
.svg)
.svg)
.svg)


.svg)


Whether you are a student, business owner, researcher, marketing professional, educator, or healthcare professional, everyone who is at least involved with data once needs pie charts!
Data visualization is an essential requirement to understand data. One of the best tools for visualization is pie charts, and if you need bar charts, check out our bar graph maker as well. Pie charts are easy to understand and visually attractive. As they are common, pie charts can be used when addressing the general audience.
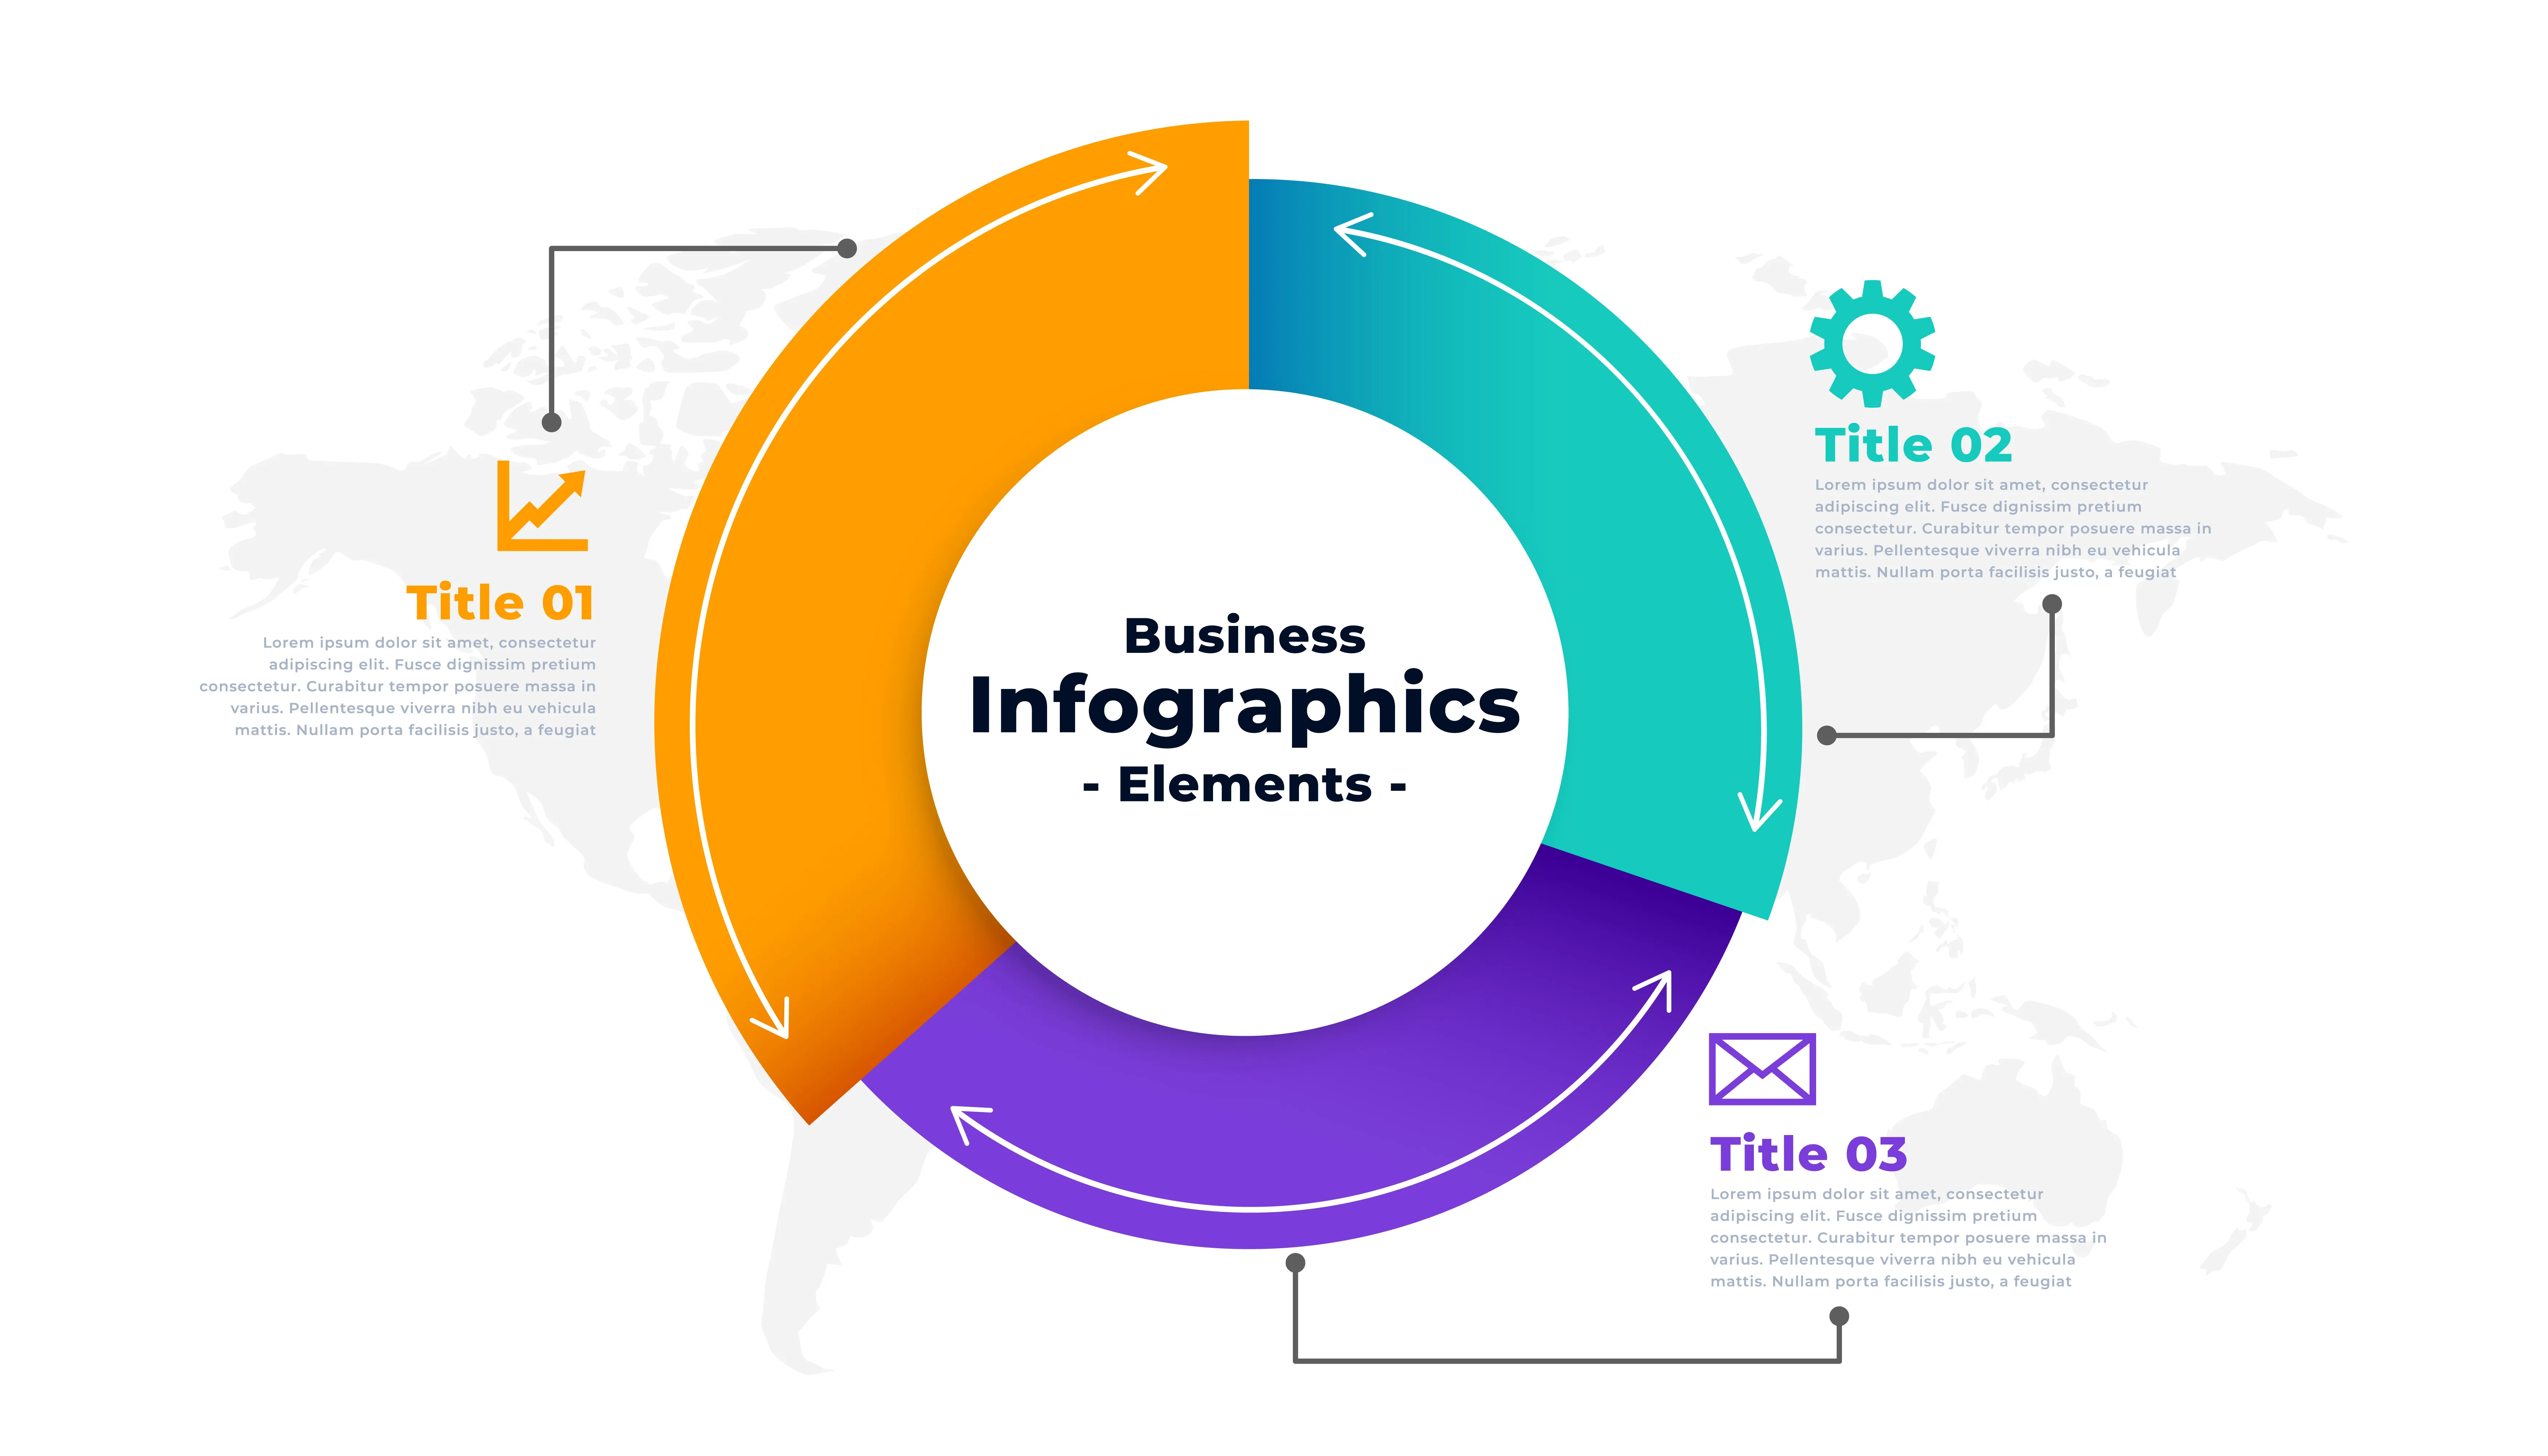
What Is a Pie Chart?
A pie chart is a statistical graphic in a circular format. The circle itself corresponds to the whole and includes slices. Each slice represents a proportionate part of the whole. The total of all the slices is equal to 100%.
Pie charts include:
- Slices: A pie is divided into slices. Each slice represents a different category or part of the data set.
- Center: The center is the center of the pie that each slice radiates.
- Labels: Each slice is labeled with a corresponding category or percentage.
- Legend: A legend includes information on how to read the data. It includes information about colors and what they represent.
- Title: Pie charts usually include a title. A title gives information about the data on the pie chart and enables us to give meaning to the graph.

How to Create a Pie Chart?
Creating a pie chart manually can be challenging. If you are not a data expert or not experienced, it can take up your hours.
Traditionally, pie charts are drawn by hand. Percentages are calculated and proportionalized manually. After, pie charts are created, specifically for each data. This process was time-consuming and required effort, time, and energy.
However, for several years, we have not manually created pie graphs. These days, all you have to do is enter your data in the pie chart makers, and the rest will come automatically!
Even better, the best AI presentation maker like Decktopus generates pie charts automatically as part of your full deck. No manual data entry, no chart formatting.
Top 10 Pie Chart Creators
1) Decktopus

Decktopus AI is an AI-powered presentation tool that builds full decks from a short description. When your presentation needs a pie chart, Decktopus generates it automatically as part of the deck, so you don't have to switch tools or design charts manually.
Decktopus includes features such as:
- AI Presentation Generation: Full deck built from your topic in minutes
- Auto-generated charts and visuals (Bar Chart Maker, Pie Chart Maker, Line Chart Maker, Donut Chart Maker and more) inside your presentation
- Brand Import: Paste your website URL to auto-apply your brand
- Brand Compliance: Auto-checks every slide for brand consistency
- Prompt-based Editing: Refine any slide by typing what you want changed
- Slide Library: Save and reuse high-performing slides
- Version History: Restore any past version in one click
- Export as PDF or PPT, share via link, or present directly
- AI Image Generator
- PDF to Deck Import
There are several other features available on Decktopus! You can try it for FREE after signing up with your email! Try the Decktopus experience yourself!
Pie charts in Decktopus are generated as part of your full presentation, not as standalone outputs. Here's how it works:
- Describe your topic. Type what your deck is about and include the data points you want to visualize. Or upload a spreadsheet with your numbers.
- Choose your style. Paste your website URL to apply your brand automatically, or let AI generate a style.
- Review the outline. Decktopus adds pie charts where they help communicate your data.
- Refine in the editor. Use the prompt bar to adjust any chart with instructions like "switch this to a pie chart" or "highlight the largest slice." Brand Compliance keeps everything on-brand.
- Export or share. Download as PDF or PPT, share via link, or present directly.

Key Features of Decktopus’s Pie Chart Maker:
- What you get with Decktopus:
- Pie charts generated automatically from your data
- On-brand colors, fonts, and styling applied across every slide (no manual setup)
- Refine any chart with a prompt (e.g., "show this as a donut chart" or "emphasize the top category")
- Brand Compliance auto-checks every chart for consistency

Pros:
- Decktopus is an online tool that is accessed through your web browser! You can access your work anywhere and anytime to make adjustments or present!
- Describe your topic and Decktopus generates a complete, ready-to-present deck with text, charts, icons, and images already in place.
- You can download the created works as PDF or PPT.
- Decktopus has a collaboration feature that allows team members to work on a task simultaneously.
- More features are available for the paid plans of Decktopus! For pricing and available features, please check out our website!
2) RapidTables
RapidTables is an online tool, specified in a wide range of online tools.
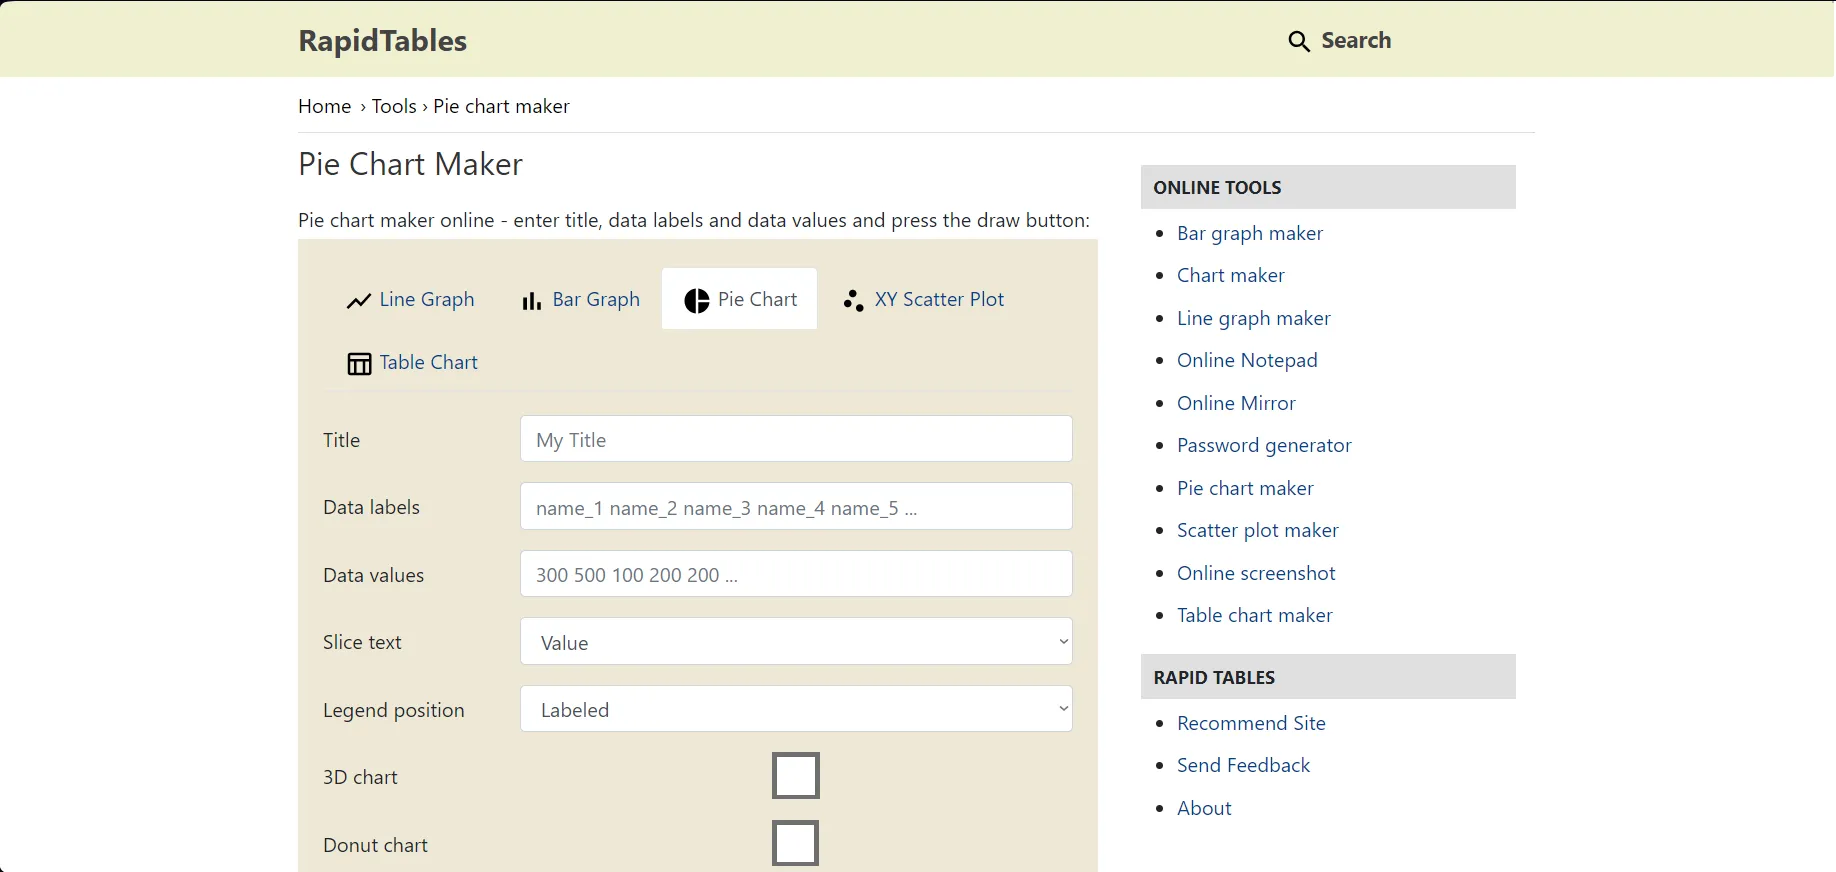
Key Features:
- RapidTables offers several calculators, such as GPA calculators, fraction calculators, BMI calculators, and so on.
- RapidTables also offers different chart makers, such as pie charts, line charts, bar graphs, XY scatter plots, and table charts.
Pros:
- RapidTables is free!
- You can review the changes on the pie chart immediately.
- You can download the charts as SVG or PNG files.
- There are donut chart and 3D pie chart options available.
- There are a few customization options, like the position of legends.
Cons:
- You have to manually enter the values and percentages. The tool does not calculate the graph by itself.
- You cannot copy-paste your data.
- The interface for entering categorical names and their values is complicated. You may have to try a few time before creating your pie chart.
- Customization features are limited.
3) Pie Chart Maker
Pie Chart Maker is another platform for creating graphs. This simple tool eases the graph-making process.
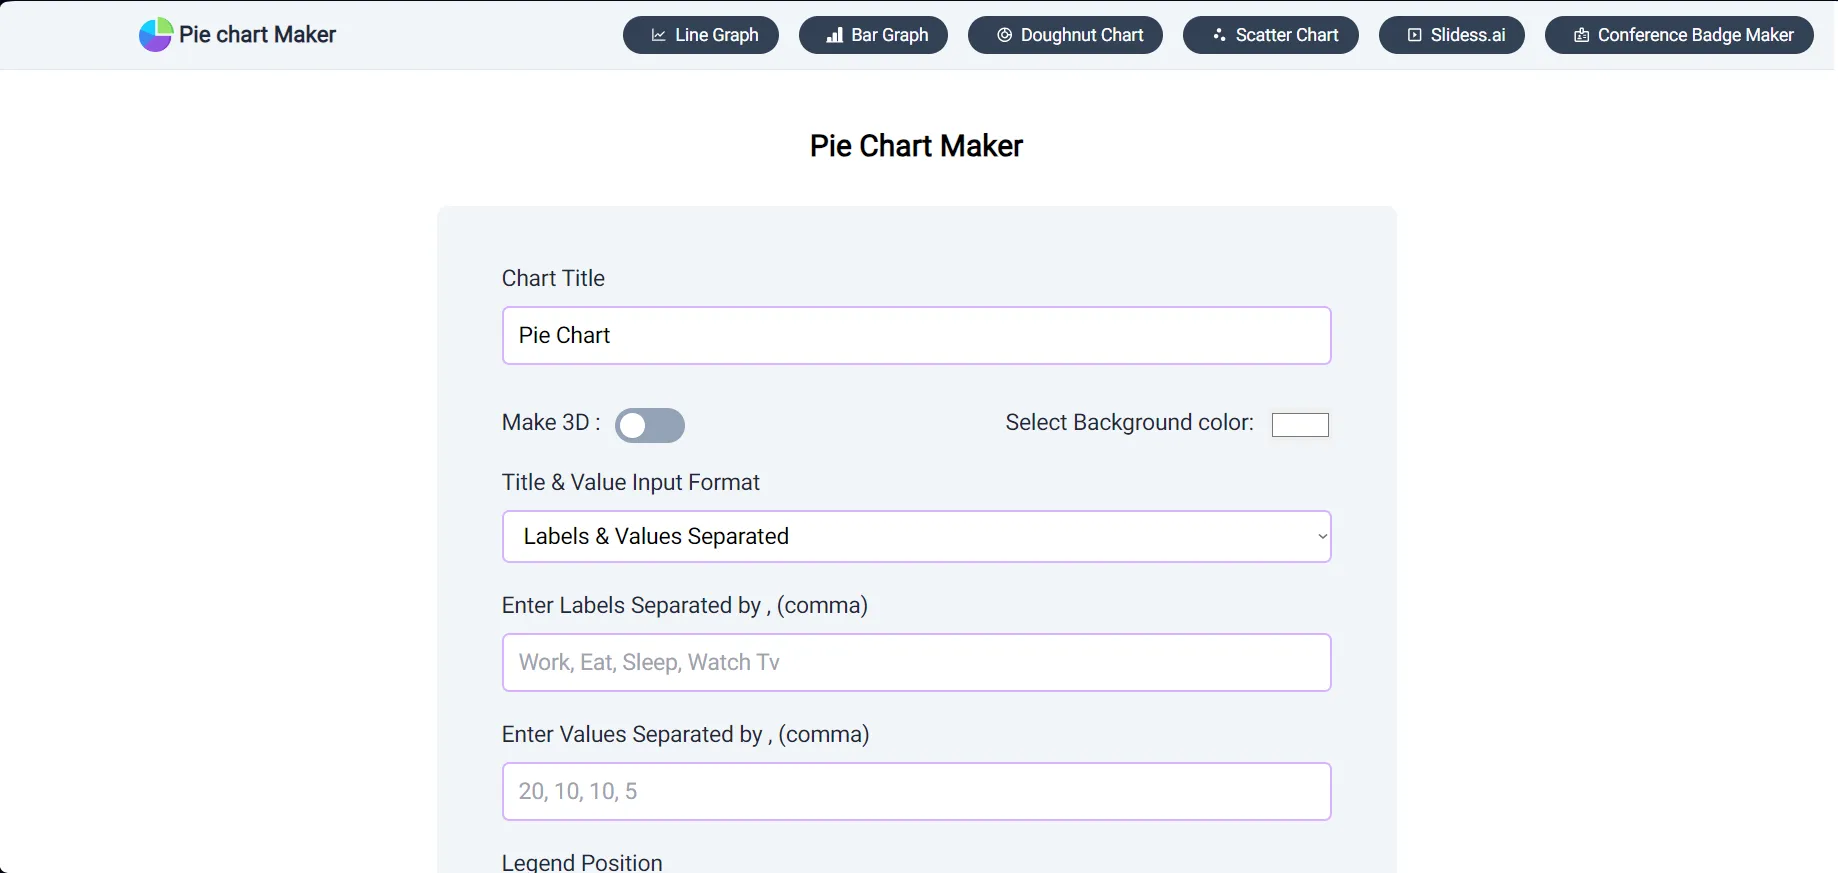
Key Features:
- On Pie Chart Maker, you can create line graphs, bar graphs, doughnut charts, and scatter charts.
- There are some customization features available.
Pros:
- Pie Chart Maker is a free online tool!
- You can download the created graphs as PNG, SVG, and JPEG files.
- You can change the title and legend font color.
- A 3D pie chart option is available.
Cons:
- The customizations are limited. The colors of pie charts cannot be changed.
- You have to manually enter all the data.
- Does not have a collaboration feature.
4) Kids’Zone
Created by the National Center for Educational Statistics, Kids’Zone offers several functions, such as graph maker, quizzes, and informational games.
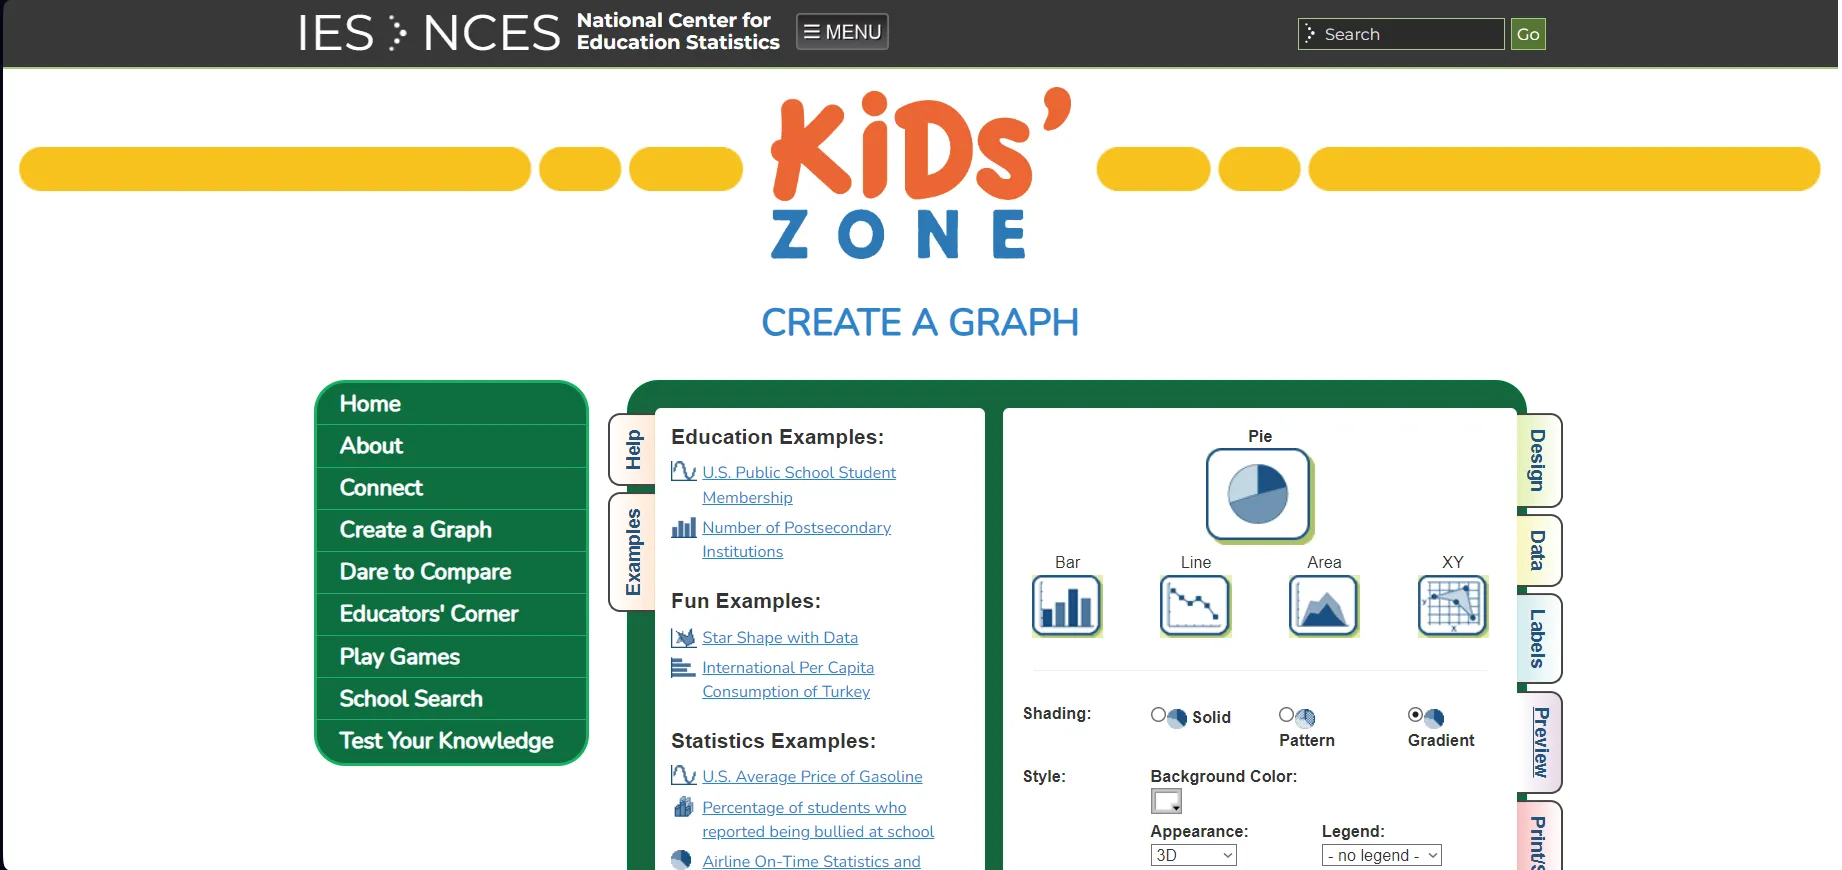
Key Features:
- Kids’Zone offers several graph types on the graph maker. These are bar graphs, line graphs, area charts, XY scatter plots, and pie charts.
- Kids’Zone has an easy-to-use interface, as it is specifically designed for children.
Pros:
- Kids’Zone Pie Chart Maker is easy to use.
- The tool allows the customization of colors for specific values.
- The shading of graph and graph type can be changed as well.
- Customizations are available for fonts and colors of the texts.
- Kids’Zone Pie Chart Maker supports up to 50 slices per pie chart.
Cons:
- The created pie charts are not aesthetically pleasing.
- Does not have a collaboration feature.
- You have to manually enter all the data. The values cannot be pasted from other sources.
5) Visual Paradigm
Visual Paradigm is a data visualization software. Created for business professionals, Visual Paradigm can create professional-looking slides with several templates.
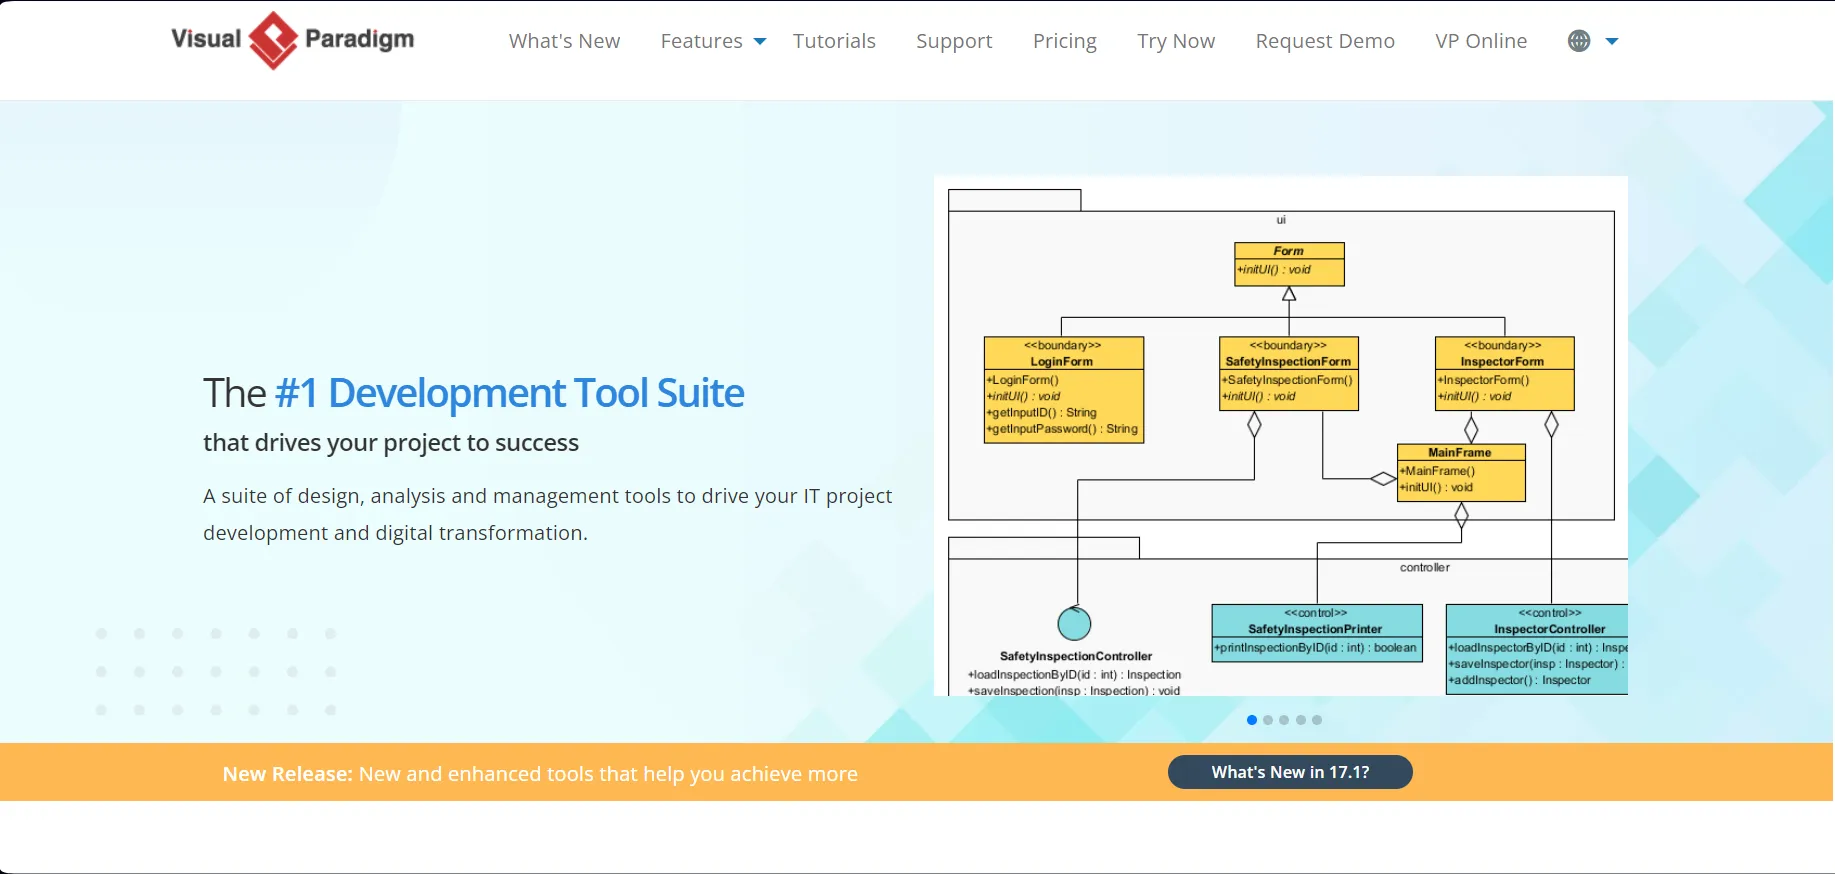
Key Features:
- There are several templates available, from flow charts to different types of pie charts!
- Templates are wide in range and speed up the creation of different types of charts and graphs.
Pros:
- Visual Paradigm offers a 30-day free trial!
- Several customization features, such as colors and fonts, are available.
- Visual Paradigm supports the collaboration feature.
Cons:
- After the free trial period, Visual Paradigm requires a subscription plan for usage.
- The tool for the creation of pie charts is relatively expensive.
6) Meta-Chart
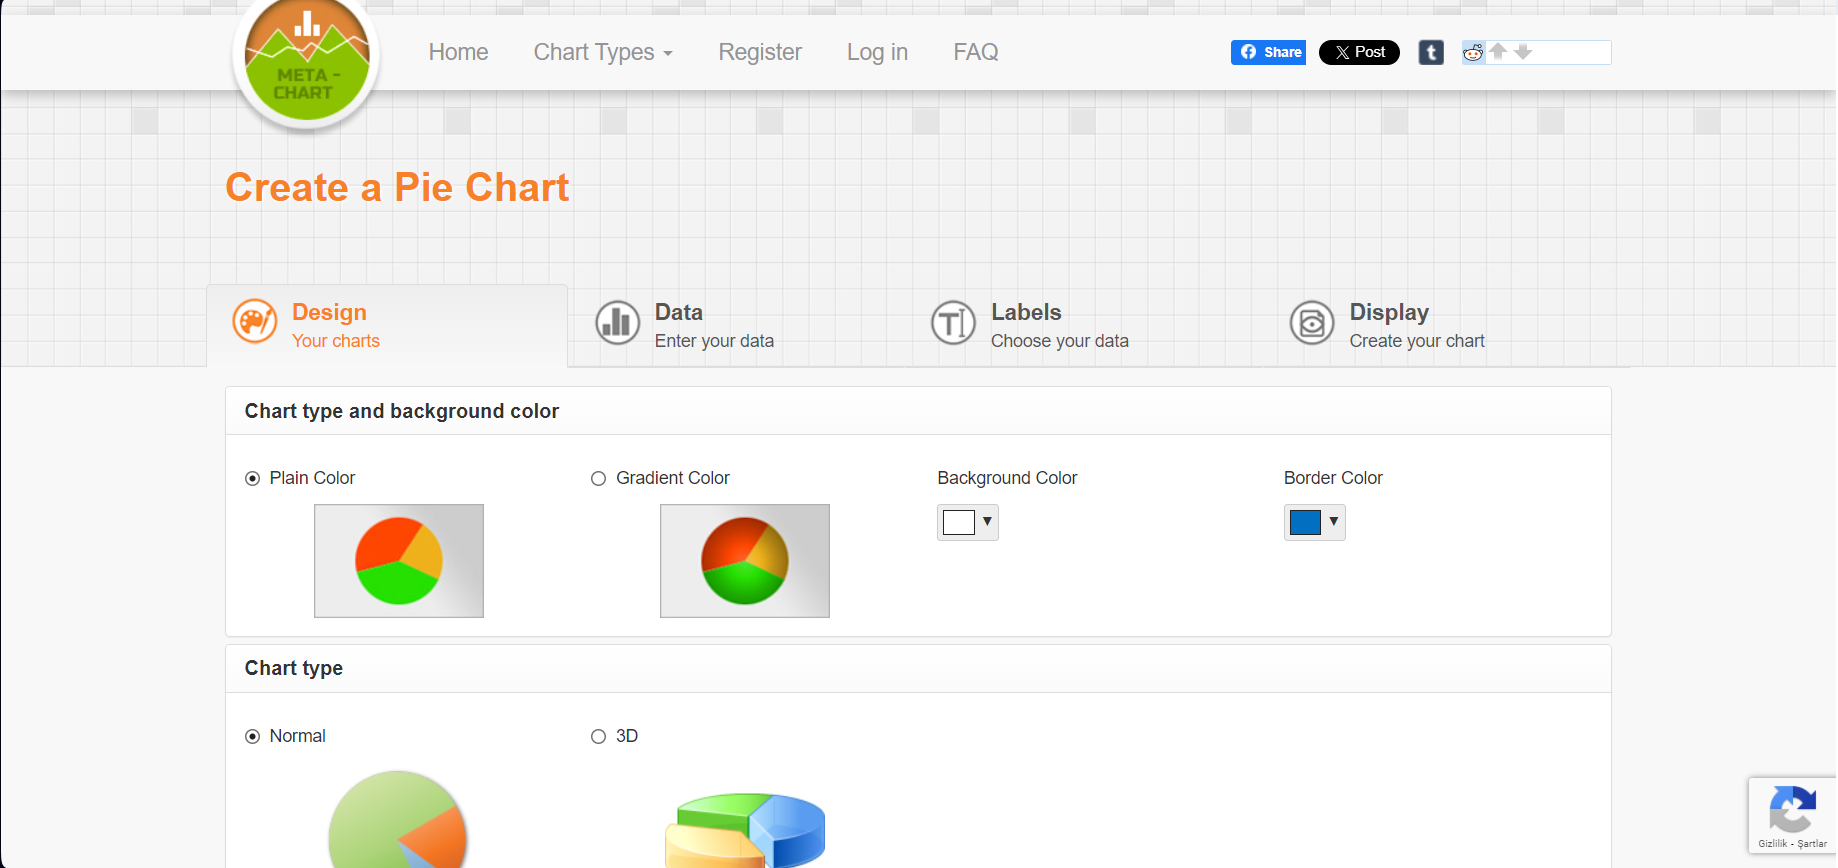
Key Features:
- There are a number of chart types available: Pie Chart, Venn Chart, Bar Chart, Histogram, Multiple Bar Chart, Scatter Plot Chart, Line Chart, Area Chart, Spline Chart, Bar and Pie Chart, Box and Whisker Chart and Tally Chart.
- Meta-Chart offers several customizations and review options before downloading your chart.
Pros:
- Meta-Chart is FREE.
- You can enter your data manually or upload CSV files to create pie charts.
- There are several customizations available. These are the colors of slides, fonts, text sizes, and which information is displayed on graphs.
Cons:
- This is rather a basic tool, as it cannot deal with complex data.
- Does not include a collaboration feature.
7) Microsoft Excel
Excel is one of the most popular tools included in the MS Office family. As most of the data is available as Excel files, some users prefer to create pie charts in Excel.

Key Features:
- It is a commonly used tool. This eases the process of sharing your work with others.
- Most data is already in Excel files. You don’t have to enter or paste your values into another tool.
Pros:
- Excel is FREE to use.
- You can easily share files with others or right-click on created pie charts to copy them.
- Excel has a variety of customization tools.
Cons:
- The Excel environment is different from other Microsoft Office applications. It may take time for users to adjust and use it fluently.
- MS Excel has a collaboration feature, but it is only available for Microsoft 365 subscribers.
8) Google Sheets
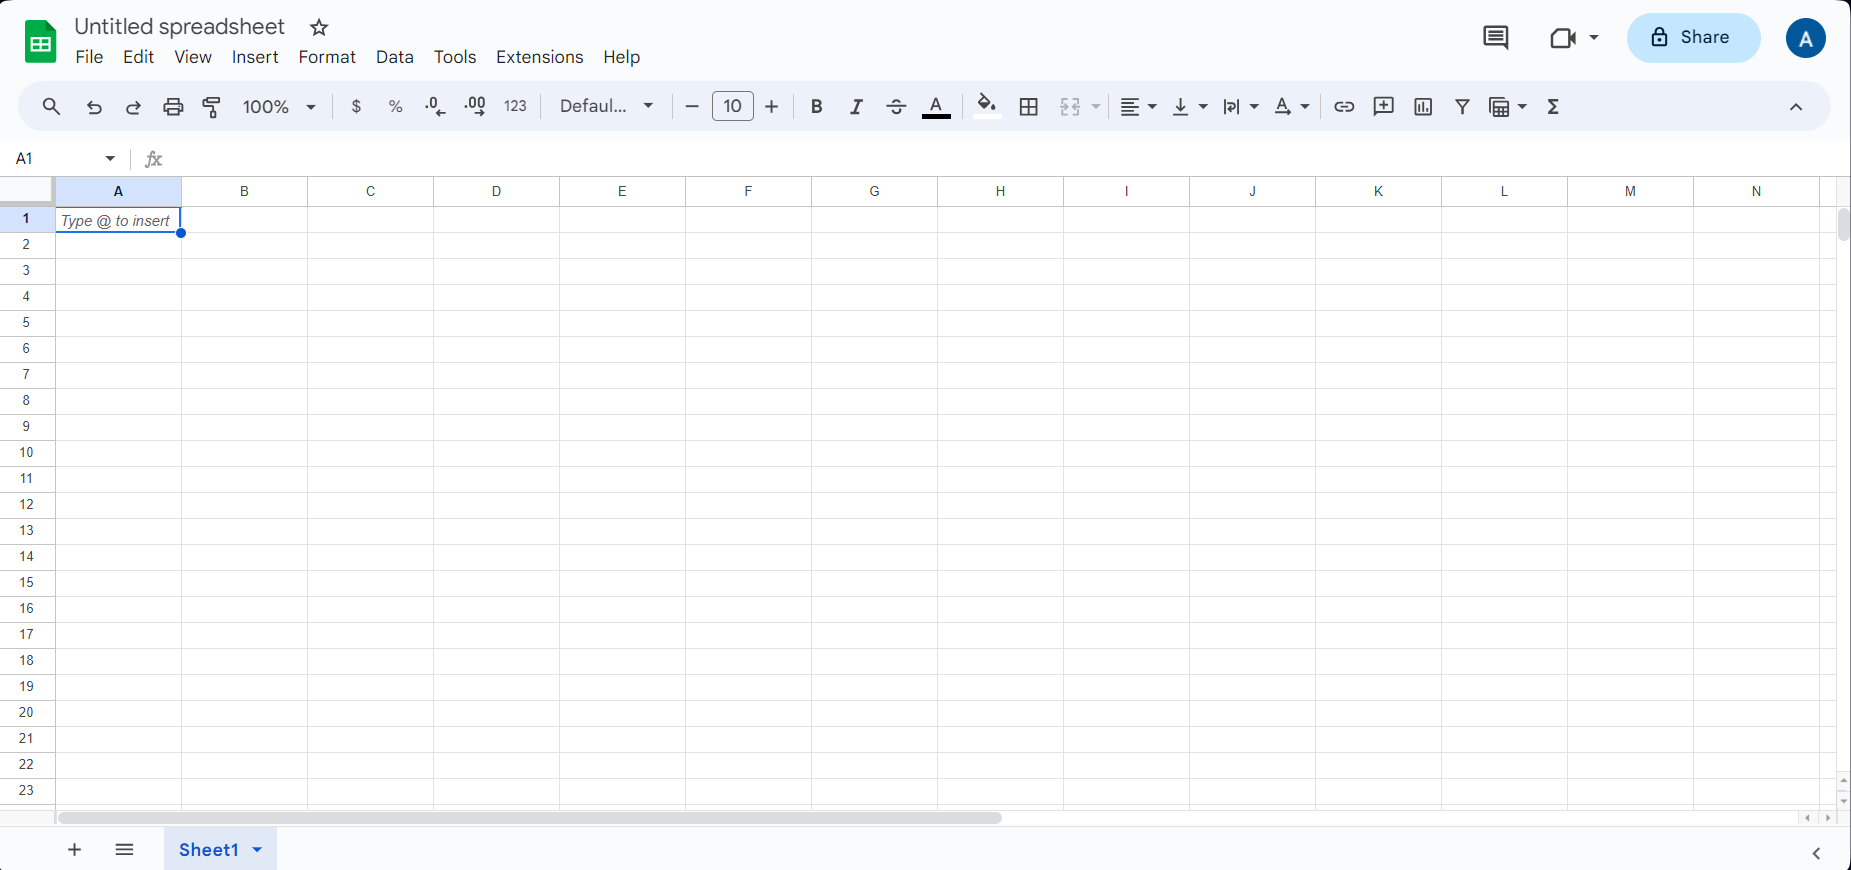
Key Features:
- Though it is similar to Excel, Google Sheets is more user-friendly and easy to use.
- You can immediately back up your files on Google Drive.
Pros:
- Google Sheets has an easy-to-use interface.
- You can make several customizations.
- Google Sheets has a collaboration feature. You can add others to make adjustments on the same spreadsheet.
- You can export your Excel files directly.
Cons:
- Google Sheets is not as advanced as Excel when working on large amounts of data.
9) Canva
Canva is a well-known visual design and graphic tool. Canva can create many types of visualizations, and there are several pie chart templates available on it.
Key Features:
- There are several different templates on charts and infographics are available.
- Canva has a wide range of customizations.
Pros:
- Canva has a FREE plan!
- Canva has a collaboration feature, allowing you to work on the project with your teammates.
Cons:
- The free plan is limited, and some features cannot be accessed through it.
- Data cannot be pasted. You have to manually transfer an already existing pie chart to the template.
- Pricing may be expensive compared to the other tools.
10) LucidCharts
Key Features:
- Lucidchart is a professional diagram maker, usually used by businesses.
Pros:
- There are several templates available.
- Customization features are wide.
- You can use it online or download it.
Cons:
- The interface may be complex for novice or inexperienced users.
Frequently Asked Questions
1) How can I create a pie chart with percentages?
You can create a pie graph with percentages on Decktopus! Describe your data in Decktopus or upload a spreadsheet, and your pie chart is generated automatically with percentages labeled. Refine anything with a prompt, or click into individual slices to emphasize specific data points.
Also, if you want to emphasize a specific slice, all you have to do is click on it! It will separate itself from the whole, allowing you to communicate your ideas better!
2) What are some online tools for pie chart makers?
There are several pie chart makers, as we mentioned above. However, our recommendation is Decktopus! With its easy-to-use interface, you can create your pie charts with one click!
Try Decktopusfor free. Sign up with your Google account or email. No credit card required.
3) What are the best FREE pie chart maker apps?
Here is our recommended list of FREE pie chart makers:
- Decktopus: Overall, the BEST option
- Meta-Chart: You can create 3D pie charts
- Canva: You can find many designs.
4) How can I export my pie chart as PNG?
Most pie chart makers let you export as PNG. With Decktopus, your charts are part of a full presentation, so you can export the whole deck as PDF or PPT, or share via link.
.png)

.avif)


.svg)
.svg)
.svg)
.svg)
.svg)
.svg)
.svg)
