Templates & How-to
Create Your Spotify Pie Chart: How to Find Your Spotify Stats
Create your own eye-catching and visually engaging Spotify pie chart, based on your listening activity! See which artists and genres are your favorites and share with your friends!

Spotify Wrapped is one of the most exciting events that signals the end of the year. Once a year, Spotify users get a chance to see their listening stats. These include top genres, lyrics, artists, songs, and total minutes spent on listening. Wrapped also creates a playlist from your favorite song of the year!
Discover your Spotify Wrapped anytime you want, with Spotify Pie Chart. No need to wait for the once-a-year event! Get instant access and give your consent for a breakdown of your music preferences.

Delve into a detailed breakdown of your listening habits with Spotify Pie Chart. Uncover the intricacies of your favorite genres, artists, and songs, all at your fingertips. Though it is a highly anticipated event by Spotify users, wrapped results are only available once a year. Users don’t get a chance to look at their statistics any other time. But no more!
With Spotify Pie Chart and a pie chart maker, you can access your Wrapped whenever you want! In addition, customize your chart with Decktopus and make it as unique as your Amazon wishlist. Add your favorite artists, genres, and colors to create a personalized musical masterpiece! For a cleaner layout, graphic design ideas can help you balance genre labels, colors, and empty space around the chart.
What is a Spotify Pie Chart?
Spotify Pie Chart allows you to analyze your listening habits. The chart analyzes your most frequently played songs, artists, and genres to create an overall look.
All artists are included, from Taylor Swift to K-pop bands. Similarly, from alternative rock to indie, from underground hip hop to metropopolis, all music genres are included in the pie!
Learn which artists you listen to more, which songs are your favorite, and what genre you love the most with these pie charts! Create beautiful and visually appealing charts with Decktopus!

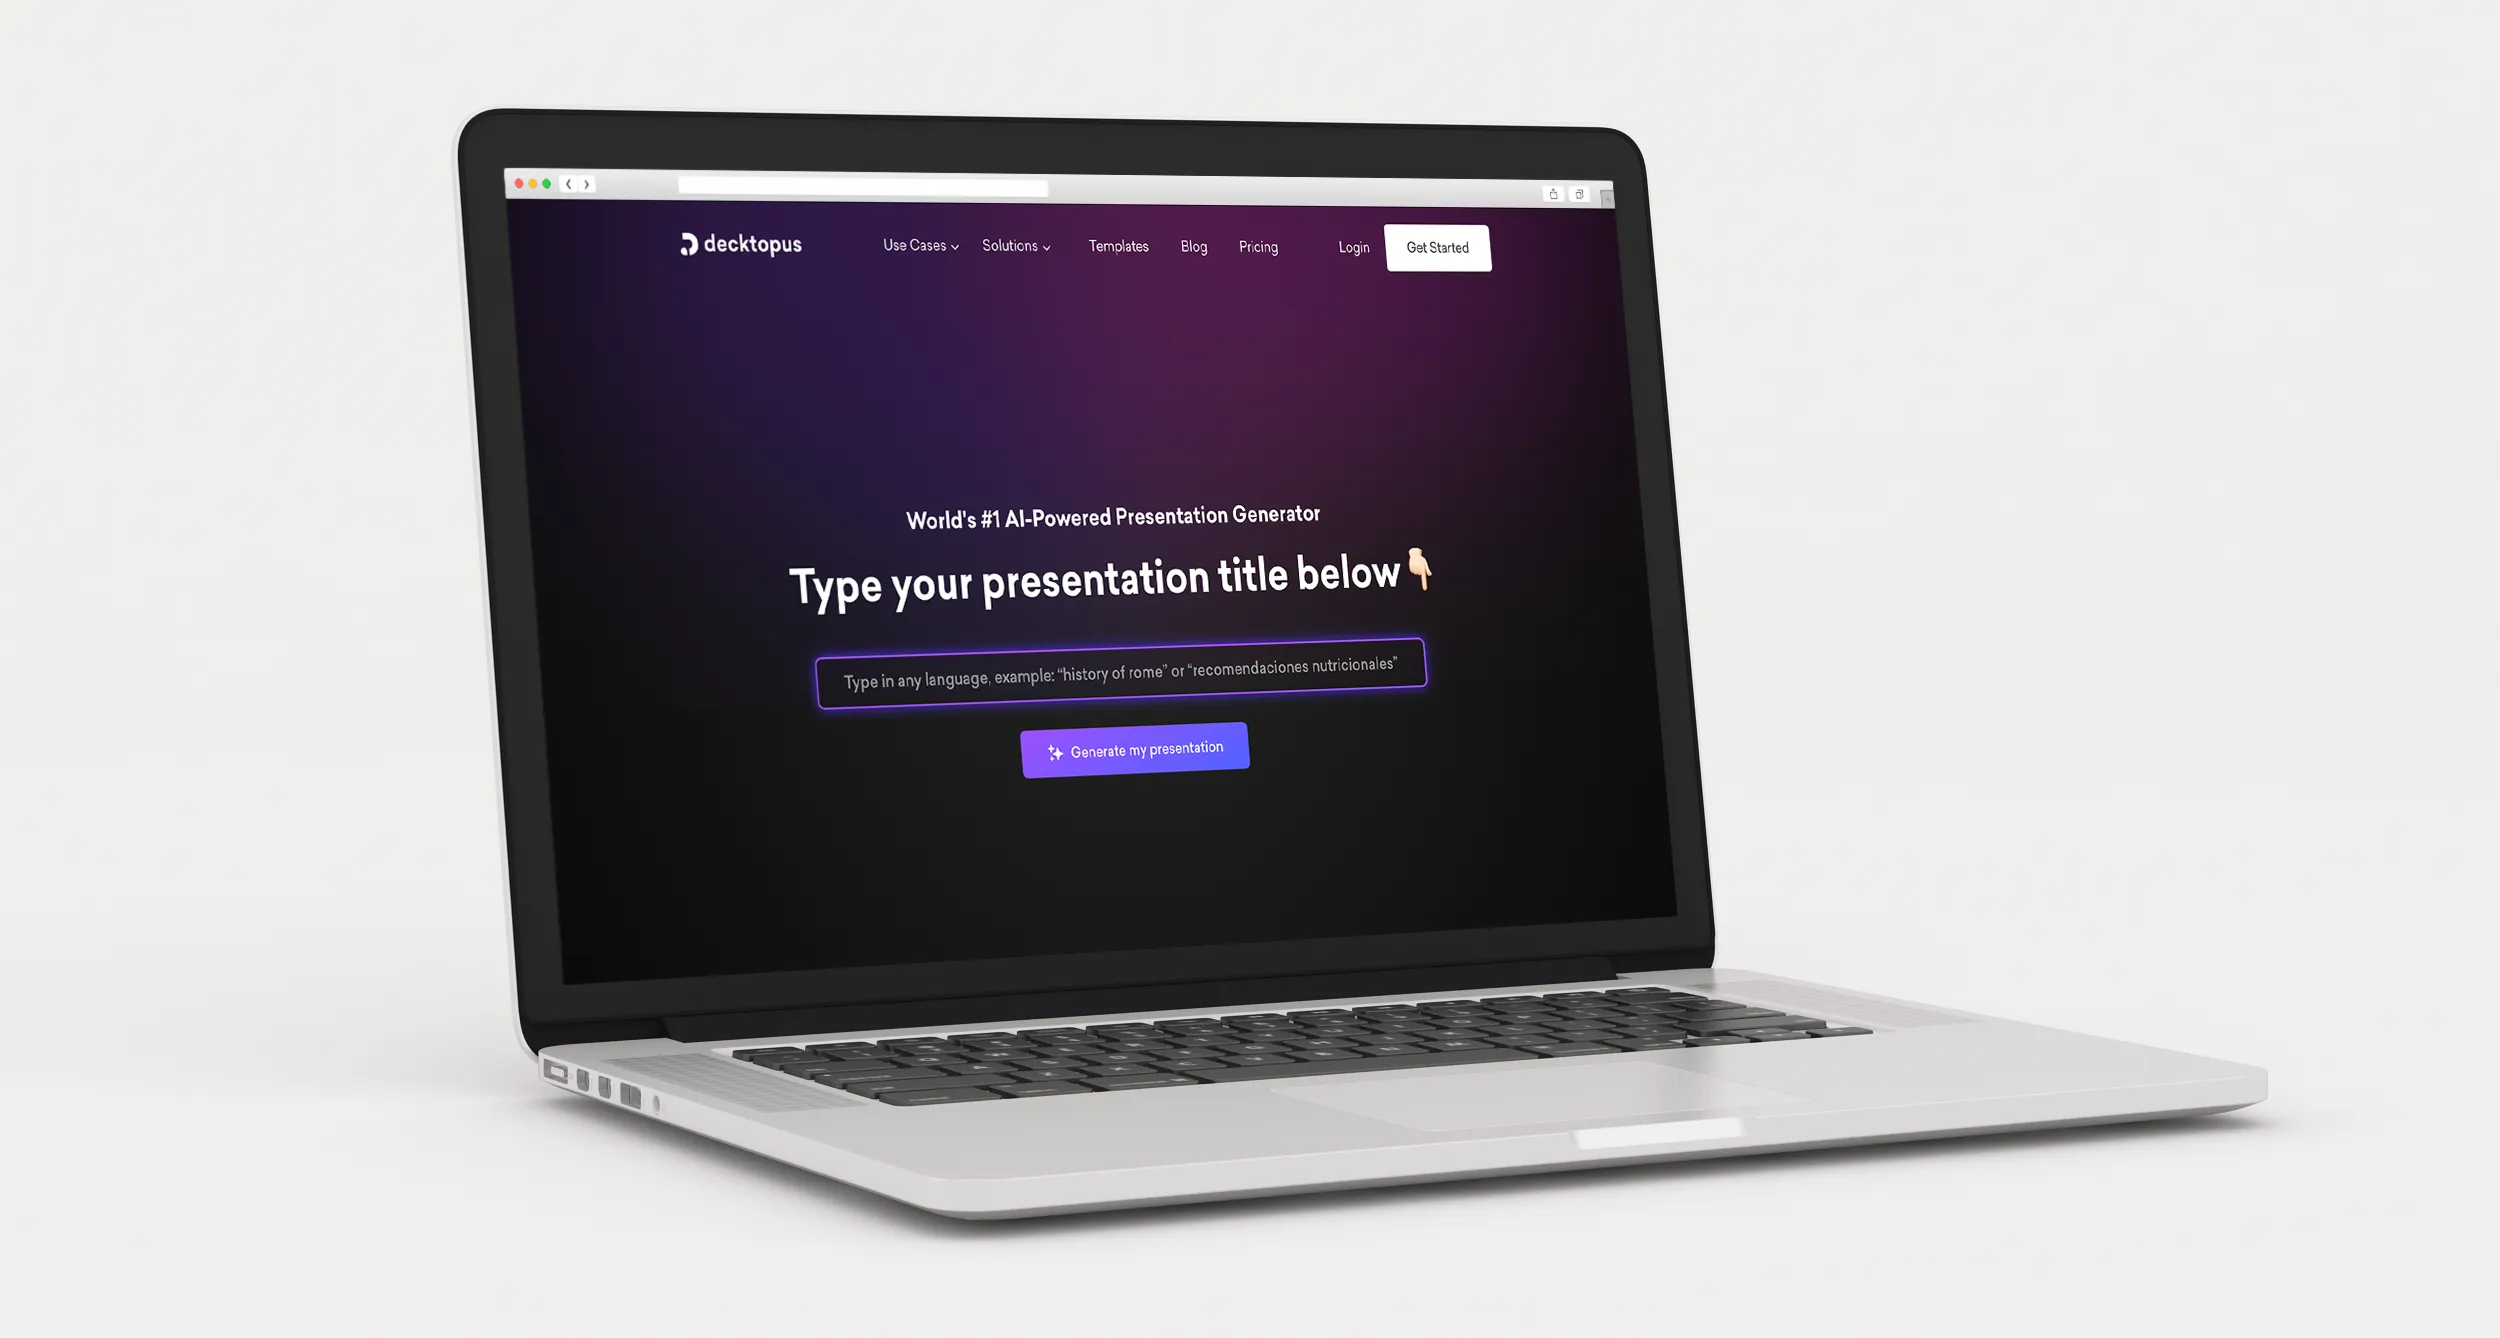
Create a Spotify Pie Chart with Decktopus
Decktopus is a presentation tool specialized in creating fast and ready-to-present AI-generated presentations. Decktopus is able to create beautiful slides, personally created for your topic, audience, aim, and duration.
Decktopus has a wide set of features that separate it from other presentation tools.
Decktopus is one of the leading presentation tools. It is easy to log in, FREE to use, and has an easy-to-adjust interface that allows users to quickly get used to it. You can learn about the Decktopus experience by trying it yourself!
However, though Decktopus is a presentation tool, its capabilities go beyond this! Here is a list of features available in Decktopus:
Decktopus Key Features
[[EMBED:PGRpdiBzdHlsZT0ib3ZlcmZsb3cteDphdXRvO21hcmdpbjoyMHB4IDAiPjx0YWJsZSBzdHlsZT0id2lkdGg6MTAwJTtib3JkZXItY29sbGFwc2U6Y29sbGFwc2U7Zm9udC1zaXplOjE1cHg7bWFyZ2luOjhweCAwIj48dHI+PHRoIHN0eWxlPSJib3JkZXI6MXB4IHNvbGlkICNlM2U2ZWE7cGFkZGluZzoxMHB4IDE0cHg7dGV4dC1hbGlnbjpsZWZ0O2JhY2tncm91bmQ6I2Y0ZjZmODtmb250LXdlaWdodDo2MDAiPkRlY2t0b3B1cyBLZXkgRmVhdHVyZXM8L3RoPjwvdHI+PHRyPjx0ZCBzdHlsZT0iYm9yZGVyOjFweCBzb2xpZCAjZTNlNmVhO3BhZGRpbmc6MTBweCAxNHB4O3RleHQtYWxpZ246bGVmdDt2ZXJ0aWNhbC1hbGlnbjp0b3AiPlBpZSBDaGFydCBNYWtlcjwvdGQ+PC90cj48dHI+PHRkIHN0eWxlPSJib3JkZXI6MXB4IHNvbGlkICNlM2U2ZWE7cGFkZGluZzoxMHB4IDE0cHg7dGV4dC1hbGlnbjpsZWZ0O3ZlcnRpY2FsLWFsaWduOnRvcCI+RG9udXQgQ2hhcnQgTWFrZXI8L3RkPjwvdHI+PHRyPjx0ZCBzdHlsZT0iYm9yZGVyOjFweCBzb2xpZCAjZTNlNmVhO3BhZGRpbmc6MTBweCAxNHB4O3RleHQtYWxpZ246bGVmdDt2ZXJ0aWNhbC1hbGlnbjp0b3AiPkxpbmUgQ2hhcnQgTWFrZXI8L3RkPjwvdHI+PHRyPjx0ZCBzdHlsZT0iYm9yZGVyOjFweCBzb2xpZCAjZTNlNmVhO3BhZGRpbmc6MTBweCAxNHB4O3RleHQtYWxpZ246bGVmdDt2ZXJ0aWNhbC1hbGlnbjp0b3AiPkJhciBDaGFydCBNYWtlcjwvdGQ+PC90cj48dHI+PHRkIHN0eWxlPSJib3JkZXI6MXB4IHNvbGlkICNlM2U2ZWE7cGFkZGluZzoxMHB4IDE0cHg7dGV4dC1hbGlnbjpsZWZ0O3ZlcnRpY2FsLWFsaWduOnRvcCI+QUktUG93ZXJlZCBQcmVzZW50YXRpb24gQ3JlYXRpb248L3RkPjwvdHI+PHRyPjx0ZCBzdHlsZT0iYm9yZGVyOjFweCBzb2xpZCAjZTNlNmVhO3BhZGRpbmc6MTBweCAxNHB4O3RleHQtYWxpZ246bGVmdDt2ZXJ0aWNhbC1hbGlnbjp0b3AiPkJyYW5kIEtpdCBJbnRlZ3JhdGlvbjwvdGQ+PC90cj48dHI+PHRkIHN0eWxlPSJib3JkZXI6MXB4IHNvbGlkICNlM2U2ZWE7cGFkZGluZzoxMHB4IDE0cHg7dGV4dC1hbGlnbjpsZWZ0O3ZlcnRpY2FsLWFsaWduOnRvcCI+UERGIHRvIERlY2sgSW1wb3J0PC90ZD48L3RyPjx0cj48dGQgc3R5bGU9ImJvcmRlcjoxcHggc29saWQgI2UzZTZlYTtwYWRkaW5nOjEwcHggMTRweDt0ZXh0LWFsaWduOmxlZnQ7dmVydGljYWwtYWxpZ246dG9wIj5BSSBQcm9tcHQgRWRpdGluZzwvdGQ+PC90cj48dHI+PHRkIHN0eWxlPSJib3JkZXI6MXB4IHNvbGlkICNlM2U2ZWE7cGFkZGluZzoxMHB4IDE0cHg7dGV4dC1hbGlnbjpsZWZ0O3ZlcnRpY2FsLWFsaWduOnRvcCI+U2xpZGUgTGlicmFyeTwvdGQ+PC90cj48dHI+PHRkIHN0eWxlPSJib3JkZXI6MXB4IHNvbGlkICNlM2U2ZWE7cGFkZGluZzoxMHB4IDE0cHg7dGV4dC1hbGlnbjpsZWZ0O3ZlcnRpY2FsLWFsaWduOnRvcCI+VmVyc2lvbiBIaXN0b3J5PC90ZD48L3RyPjx0cj48dGQgc3R5bGU9ImJvcmRlcjoxcHggc29saWQgI2UzZTZlYTtwYWRkaW5nOjEwcHggMTRweDt0ZXh0LWFsaWduOmxlZnQ7dmVydGljYWwtYWxpZ246dG9wIj5QREYgJiBQb3dlclBvaW50IEV4cG9ydDwvdGQ+PC90cj48L3RhYmxlPjwvZGl2Pg==]]
With Decktopus’s Pie Chart Maker, you can create a visually appealing and attention-grabbing pie chart. Later, you can share with your friends and family! Compare your taste with others!
Fastest Method to Make Pie Chart
With the new addition to Decktopus, you can easily create your own pie chart! These charts come in a variety of colors and formats.
Here is a step-by-step tutorial to create your own pie chart with the ease of AI!
Step 1
Go to Decktopus and sign in with your Google account or email.
Step 2
Click Create New Presentation from your dashboard. Type a topic for your presentation, for example “My Spotify Listening Stats” and submit.
Step 3
Choose your style. If you have a brand kit saved, Decktopus applies it automatically. You can also import your brand from your company website, pick an AI-generated style, or let AI design one from scratch.

Step 4
Once in the editor, use the AI prompt bar to add or adjust your chart slide. Type something like “add a pie chart showing my top music genres” and Decktopus will generate it. Fill in your genre and artist data from your Spotify Pie results, and customize colors and labels to match your taste.
Step 5
When you’re happy with it, download as PDF or PowerPoint, or share via link to post on Instagram, Twitter, Reddit, or anywhere else.
[[EMBED:PGRpdiBzdHlsZT0iYmFja2dyb3VuZDpsaW5lYXItZ3JhZGllbnQoMTM1ZGVnLCM0ZjYxZmYsIzdDM0FFRCk7Ym9yZGVyLXJhZGl1czoxNnB4O3BhZGRpbmc6MzJweCAyOHB4O3RleHQtYWxpZ246Y2VudGVyO21hcmdpbjoyOHB4IDA7Y29sb3I6I2ZmZiI+PGRpdiBzdHlsZT0iZm9udC1zaXplOjIycHg7Zm9udC13ZWlnaHQ6NzAwO2xpbmUtaGVpZ2h0OjEuMzttYXJnaW4tYm90dG9tOjhweCI+Q3JlYXRlIHlvdXIgbmV4dCBwcmVzZW50YXRpb24gd2l0aCBBSTwvZGl2PjxkaXYgc3R5bGU9ImZvbnQtc2l6ZToxNXB4O2xpbmUtaGVpZ2h0OjEuNTtvcGFjaXR5Oi45MjttYXJnaW46MCBhdXRvIDIwcHg7bWF4LXdpZHRoOjUyMHB4Ij5UdXJuIGFueSB0b3BpYyBpbnRvIGEgcG9saXNoZWQsIG9uLWJyYW5kIGRlY2sgaW4gbWludXRlcyB3aXRoIERlY2t0b3B1cy48L2Rpdj48YSBocmVmPSJodHRwczovL2FwcC5kZWNrdG9wdXMuY29tL3JlZ2lzdGVyIiB0YXJnZXQ9Il9ibGFuayIgcmVsPSJub29wZW5lciIgc3R5bGU9ImRpc3BsYXk6aW5saW5lLWJsb2NrO2JhY2tncm91bmQ6I2ZmZjtjb2xvcjojNGY2MWZmO3BhZGRpbmc6MTRweCAzMnB4O2JvcmRlci1yYWRpdXM6MTBweDtmb250LXdlaWdodDo2MDA7Zm9udC1zaXplOjE1cHg7dGV4dC1kZWNvcmF0aW9uOm5vbmUiPkdldCBTdGFydGVkIEZyZWU8L2E+PC9kaXY+]]
Spotify Pie Chart Step-by-Step Tutorial
Step 1
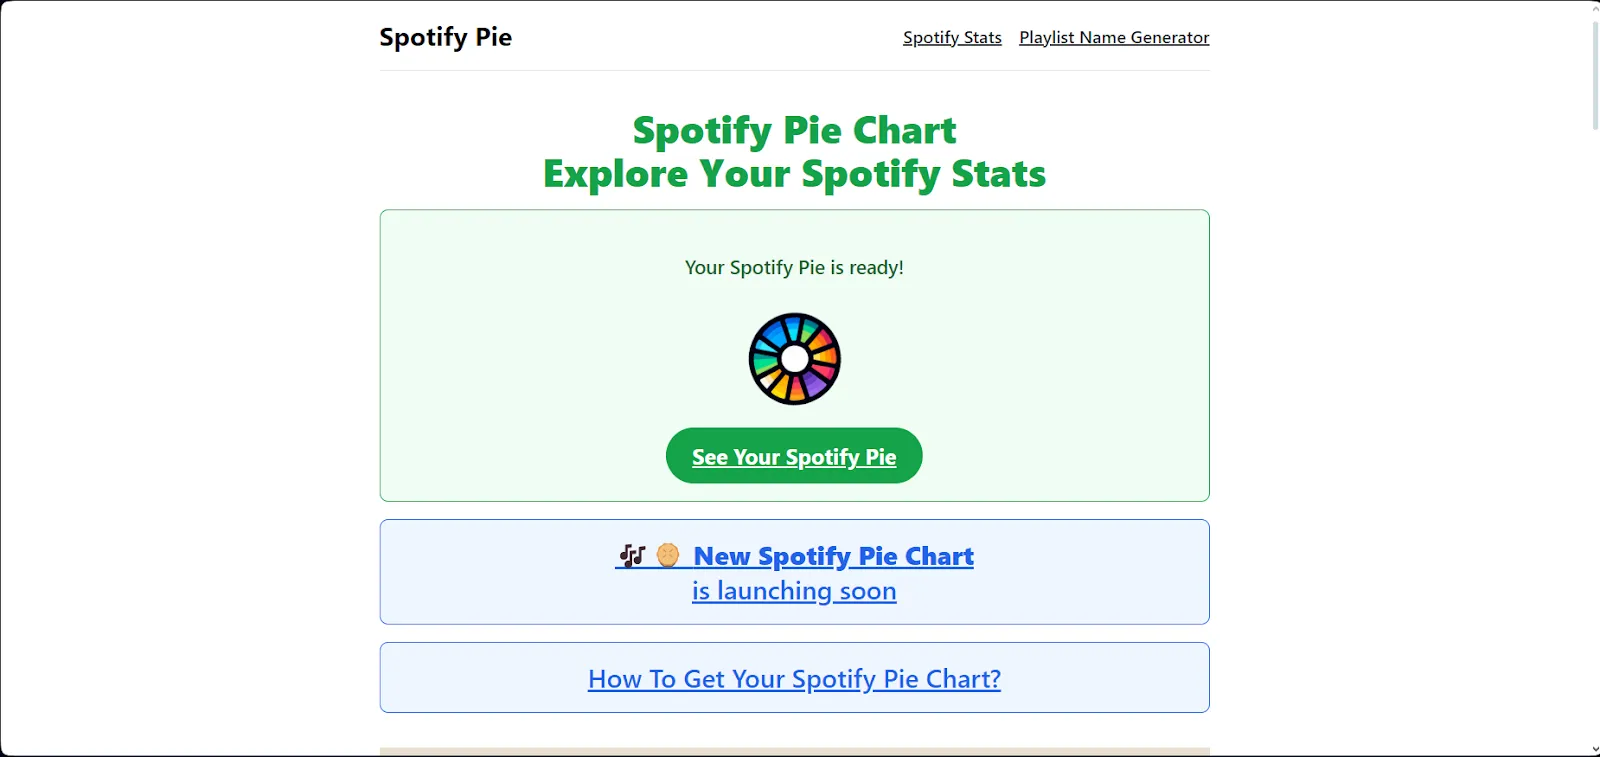
Go to the website. This site will bake your pie! Click on the “See Your Spotify Pie” button.
Step 2
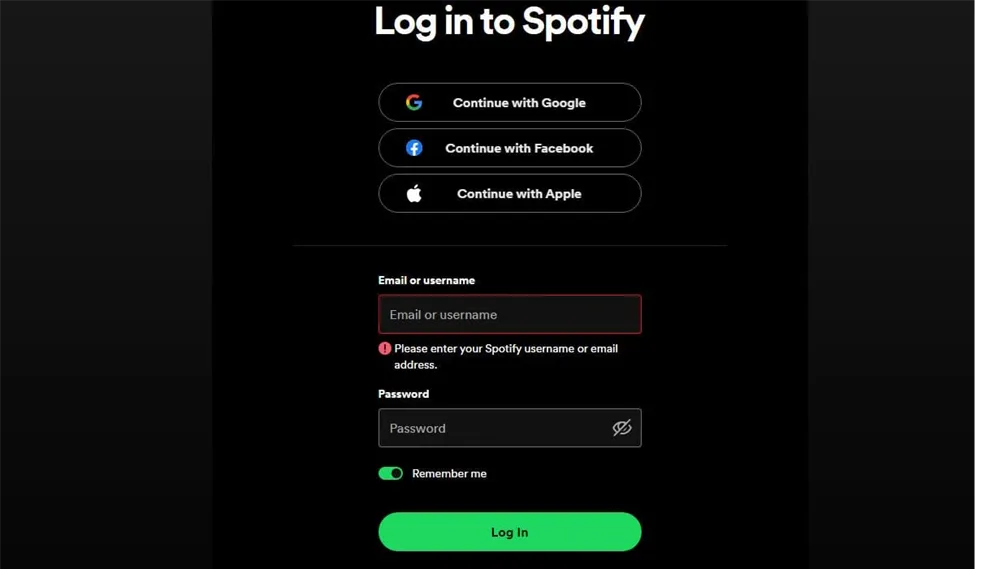
Link the website to your Spotify account. Enter your login credentials to Spotify, in the opened window.
Spotify will ask you for permission to share your data with the website. By agreeing to it, you will allow the transaction of your statistics to create the charts.
Make sure the account you connected has a listening activity! Otherwise, the page may show a blank result, as there are no statistics to provide.
Step 3
Your pie will be generated automatically! You can take a look at the top artists and genres listed on your account on the pie chart! You can choose bubbles as well to visualize your data.
The most listened-to genres are seen with bigger pies, and the top artists’ names are larger than others. You can see them in descending order.
Hover your cursor to see which genre corresponds to which pie chart chunk.
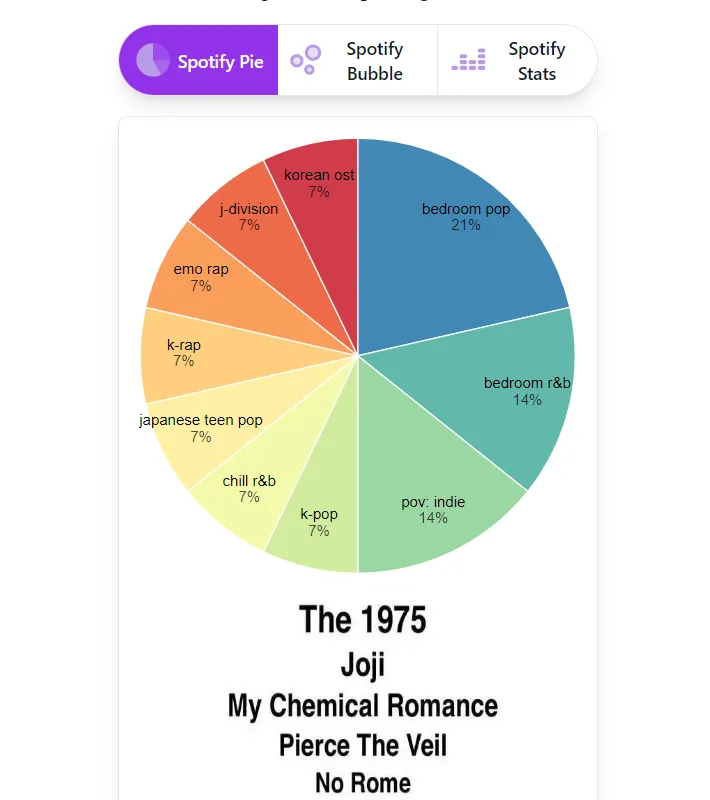
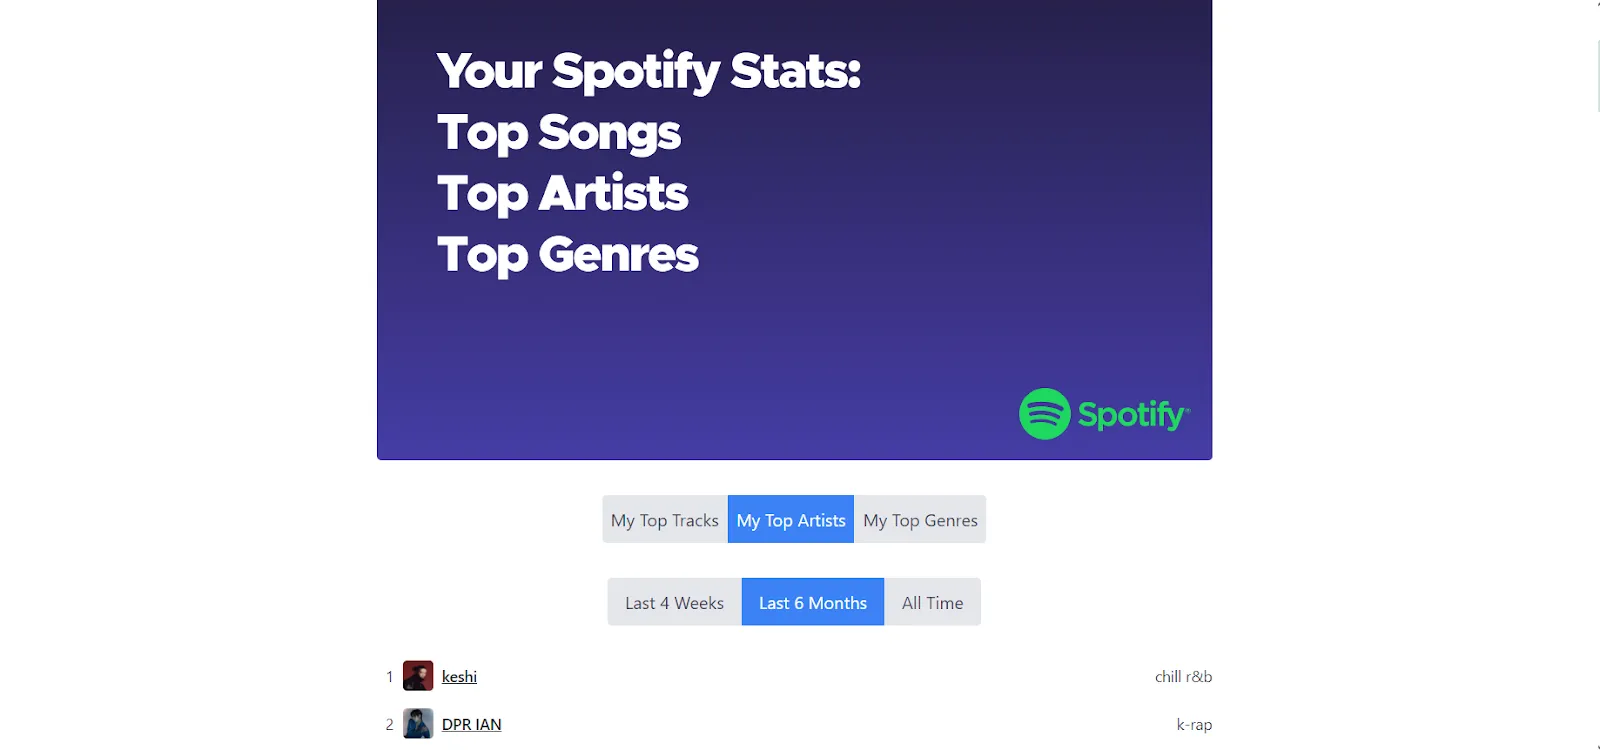
Also, in the Spotify Stats button, you can access stats for the last 4 weeks, the last 6 months, and all time. These statistics include top songs, top artists, and top genres.
Every month, the chart will be updated, so stay tuned!
Step 4
Share your results with others! Your chart is a reflection of your taste and preferences. Don’t hesitate to share with others and show your listening activity. You can click the “Download Spotify Pie” button underneath your chart or take a screenshot. If you want to add a little bit of flair, you can also take your Spotify pie chart and convert to flipbook using a tool like Flipsnack or Issuu.
You can also take a look at this YouTube video if you want to access it from your iPhone or Android phone:
[[EMBED:PGlmcmFtZSBzcmM9Imh0dHBzOi8vd3d3LnlvdXR1YmUuY29tL2VtYmVkL0ZIQXlxdDhCSjhrIiB0aXRsZT0iWW91VHViZSB2aWRlbyIgZnJhbWVib3JkZXI9IjAiIGFsbG93PSJhY2NlbGVyb21ldGVyO2F1dG9wbGF5O2NsaXBib2FyZC13cml0ZTtlbmNyeXB0ZWQtbWVkaWE7Z3lyb3Njb3BlO3BpY3R1cmUtaW4tcGljdHVyZSIgYWxsb3dmdWxsc2NyZWVuIHN0eWxlPSJ3aWR0aDoxMDAlO2FzcGVjdC1yYXRpbzoxNi85O2JvcmRlcjowO2JvcmRlci1yYWRpdXM6MTJweDttYXJnaW46OHB4IDAiPjwvaWZyYW1lPg==]]
However, you can also create a more aesthetic chart! Though this chart does give the necessary information, take a look at how you can make it more visually appealing with Decktopus! This will surely make you stand out on social media, like Instagram, Twitter, Github or Reddit! Share your Spotify Pie Chart results on social media with a visually appealing poster!
Frequently Asked Questions
1) Does the Spotify Pie Chart include artists?
Of course. The Spotify Pie Chart includes your top music genres and artists. This allows you to show your listening activity and your taste! By creating your chart in Decktopus, you can add any number of artists you wish to next to your chart.
2) Can I access the Spotify Pie Chart for Apple Music?
Unfortunately, no. However, Apple Music and YouTube Music give some statistics at the end of the year, similar to Spotify Wrapped. From this data, you can create your own chart in Decktopus! Share it with your friends and loved ones on social media!

3) How can I get specific Spotify stats?
In each year, Spotify Wrapped adds other statistics for users to enjoy. In addition to total minutes or top artists, skipping rate, the mood of your listening activity, etc., are given. You can turn these into charts and tables on Decktopus! With the chart makers, all you need to do is to add relevant information. Afterward, Decktopus will adjust the visualization!
4) How can I access my all-time Spotify charts?
The website created by Darren Huang at the University of California (UCLA) allows you to access your all-time favorite singers, genres, and songs. Follow the steps we mentioned above and see your most frequently played artists and songs.
5) Are there other apps available to see Spotify stats?
Yes. You can also use Receiptify, which is an app to give you a receipt for your listening activity. Similarly, you can use Icebergify, which shows your monthly favorite artists in an iceberg format. Lastly, you may try Instafest, which is a website that creates a festival lineup from your favorite artists. However, we recommend pie charts! Creating a pie chart is more convenient and easy to understand than other formats.

Decktopus Content Team
Related posts

How to Voice Record Audio on Powerpoint (Do a Voiceover)
This article shows you how to add and record audio/voice in PowerPoint presentation. It will cover the steps you need to take, and the software that is used.
Templates & How-to

About Me Powerpoint Template: A Simple, Easy To Use Template
Use this article as a guide while you prepare your about me PowerPoint presentation. Let’s go over the steps of creating an “about me presentation” while understanding common use cases and where should you use this kind of template.
Templates & How-to

Data Visualization: How Do You Create A Bar Graph? Examples and Bar Graph Definition
Explore the art of data visualization with our guide on creating impactful bar graphs. Learn the essentials, discover key features, and gain insights through practical examples, empowering you to effectively convey information visually.
Templates & How-to