Business & Strategy
Optimizing the SaaS Customer Journey: A Comprehensive Guide to B2B SaaS Customer Journey Maps
Learn the 6-stage SaaS customer journey framework, how to map each stage, key metrics to track, real-world case studies from top SaaS companies, and how to build your own journey deck fast.

Decktopus Content Team
What Is the SaaS Customer Journey?
The SaaS customer journey is the full end-to-end experience a customer has with a SaaS product, from the moment they first hear about it through initial evaluation, purchase, onboarding, ongoing usage, renewal, expansion, and advocacy. Unlike traditional product journeys that end at purchase, SaaS journeys are continuous. Every day a customer uses (or fails to use) the product shapes whether they renew, upgrade, or churn. The main benefit of mapping this journey is that it turns vague customer intuitions into a structured framework product, marketing, sales, and customer success teams can all optimize together.
According to research from Harvard Business Review and Bain & Company, a 5% improvement in customer retention can increase profits by 25% to 95%, and acquiring a new customer costs 5 to 25 times more than keeping an existing one. For SaaS businesses specifically, where recurring revenue depends on continuous customer engagement, the customer journey isn’t just a marketing framework. It’s the entire operating model. Companies that map and optimize their SaaS customer journey typically see 20% to 40% improvements in retention, expansion revenue, and customer lifetime value.
For related SaaS strategy content, see our guides on AI-powered SaaS, customer retention, and the customer success lifecycle.
Why SaaS Customer Journey Mapping Matters
Mapping the customer journey is a foundational discipline for every SaaS company, and its impact cascades across every team.
It Enhances Retention and Reduces Churn
For SaaS Product Managers and Customer Success Managers, retention is job one. Journey mapping identifies critical touchpoints where users may hit friction or drop off. Once you can see where users struggle (like a confusing onboarding step or a specific feature discovery moment), you can proactively address it before it turns into churn.
It Aligns Product Features With Customer Needs
Products evolve. Customer expectations evolve. Journey mapping shows which features resonate at which stages, letting Product Managers prioritize updates that add real value rather than guessing. Alignment between product roadmap and customer journey is one of the strongest predictors of SaaS growth.
It Optimizes Marketing Efforts
For Marketing Managers, journey mapping provides a clear view of when and how to engage customers. Instead of blasting the same message across every stage, teams can craft targeted campaigns that speak to the specific mindset of each phase. Conversion rates climb. Customer satisfaction climbs. Waste drops.
It Enables Data-Driven Decisions
Business Analysts and SaaS Consultants use journey maps to gather and analyze data from every touchpoint. This data-driven approach surfaces patterns, trends, and improvement opportunities that individual team members would miss on their own. See our guides on what is segmentation analysis and market analysis.
It Promotes Cross-Functional Alignment
Journey mapping creates a shared understanding across product, marketing, sales, and customer success. Every team sees the same customer experience and works together to improve it. Without a shared map, teams optimize in silos and often at cross-purposes.
Traditional Customer Journey vs. SaaS Customer Journey
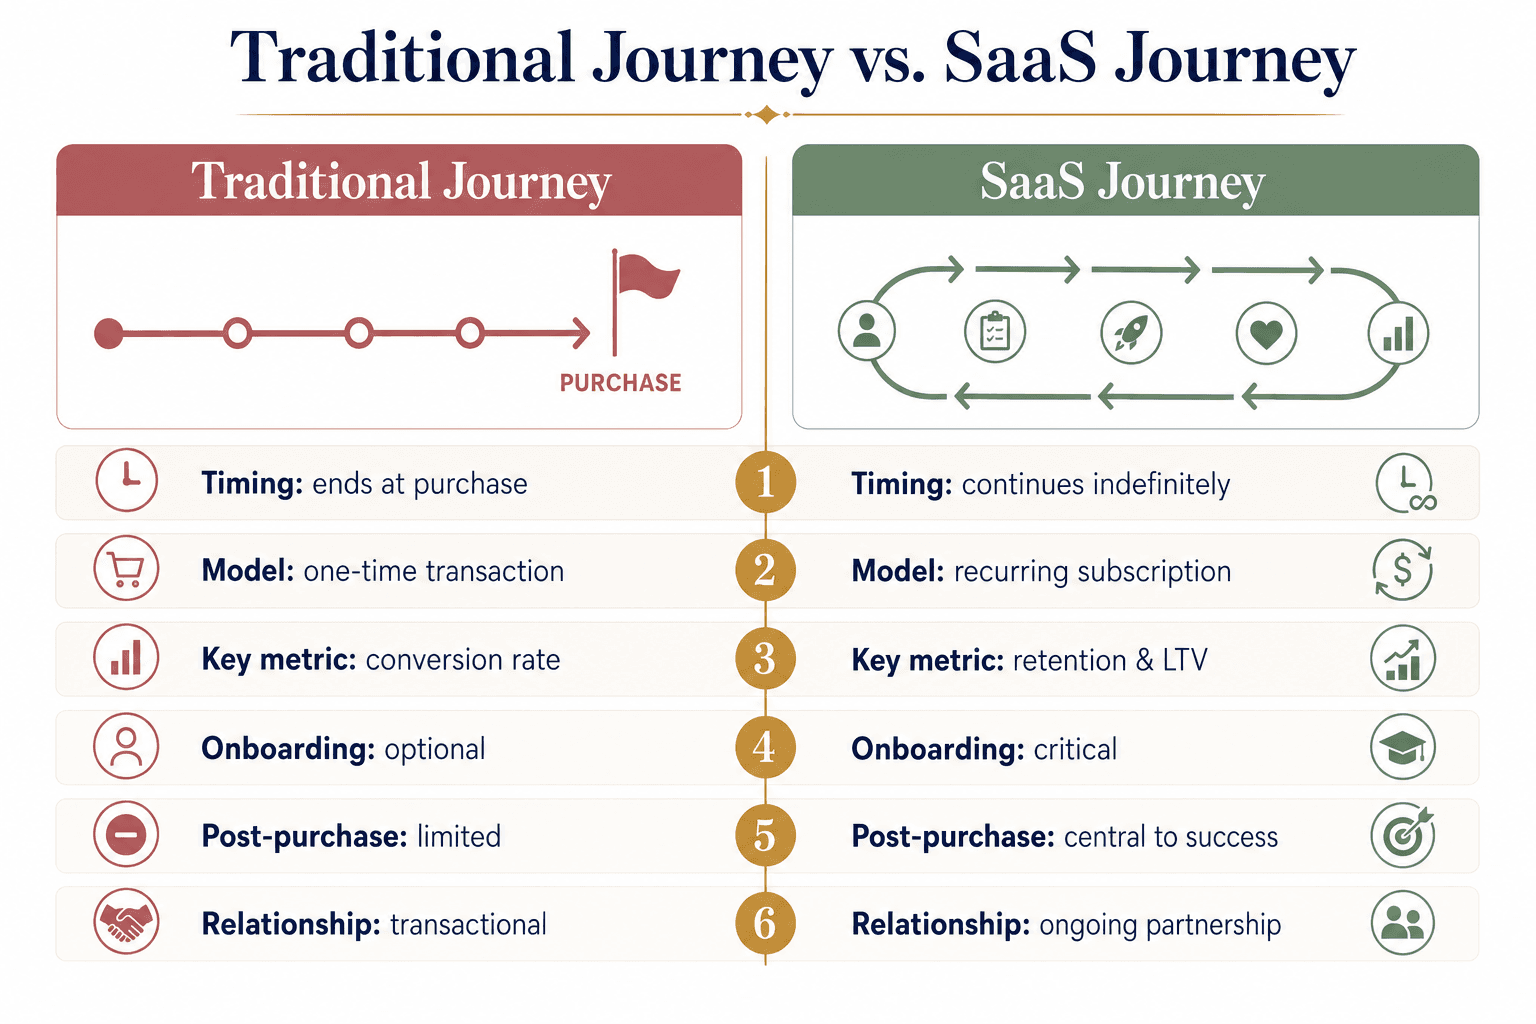
Two-column comparison infographic showing how the SaaS customer journey differs from traditional customer journeys across 6 key factors.
The SaaS journey looks very different from a traditional consumer or one-time product journey.
[[EMBED:PGRpdiBzdHlsZT0ib3ZlcmZsb3cteDphdXRvO21hcmdpbjoyMHB4IDAiPjx0YWJsZSBzdHlsZT0id2lkdGg6MTAwJTtib3JkZXItY29sbGFwc2U6Y29sbGFwc2U7Zm9udC1zaXplOjE1cHg7bWFyZ2luOjhweCAwIj48dGggc3R5bGU9ImJvcmRlcjoxcHggc29saWQgI2UzZTZlYTtwYWRkaW5nOjEwcHggMTRweDt0ZXh0LWFsaWduOmxlZnQ7YmFja2dyb3VuZDojZjRmNmY4O2ZvbnQtd2VpZ2h0OjYwMCI+PHRyPjx0aCBzdHlsZT0iYm9yZGVyOjFweCBzb2xpZCAjZTNlNmVhO3BhZGRpbmc6MTBweCAxNHB4O3RleHQtYWxpZ246bGVmdDtiYWNrZ3JvdW5kOiNmNGY2Zjg7Zm9udC13ZWlnaHQ6NjAwIj5GYWN0b3I8L3RoPjx0aCBzdHlsZT0iYm9yZGVyOjFweCBzb2xpZCAjZTNlNmVhO3BhZGRpbmc6MTBweCAxNHB4O3RleHQtYWxpZ246bGVmdDtiYWNrZ3JvdW5kOiNmNGY2Zjg7Zm9udC13ZWlnaHQ6NjAwIj5UcmFkaXRpb25hbCBKb3VybmV5PC90aD48dGggc3R5bGU9ImJvcmRlcjoxcHggc29saWQgI2UzZTZlYTtwYWRkaW5nOjEwcHggMTRweDt0ZXh0LWFsaWduOmxlZnQ7YmFja2dyb3VuZDojZjRmNmY4O2ZvbnQtd2VpZ2h0OjYwMCI+U2FhUyBKb3VybmV5PC90aD48L3RyPjwvdGhlYWQ+PHRib2R5Pjx0cj48dGQgc3R5bGU9ImJvcmRlcjoxcHggc29saWQgI2UzZTZlYTtwYWRkaW5nOjEwcHggMTRweDt0ZXh0LWFsaWduOmxlZnQ7dmVydGljYWwtYWxpZ246dG9wIj5UaW1pbmc8L3RkPjx0ZCBzdHlsZT0iYm9yZGVyOjFweCBzb2xpZCAjZTNlNmVhO3BhZGRpbmc6MTBweCAxNHB4O3RleHQtYWxpZ246bGVmdDt2ZXJ0aWNhbC1hbGlnbjp0b3AiPkVuZHMgd2hlbiB0aGUgcHVyY2hhc2UgaXMgY29tcGxldGVkPC90ZD48dGQgc3R5bGU9ImJvcmRlcjoxcHggc29saWQgI2UzZTZlYTtwYWRkaW5nOjEwcHggMTRweDt0ZXh0LWFsaWduOmxlZnQ7dmVydGljYWwtYWxpZ246dG9wIj5Db250aW51ZXMgdGhyb3VnaG91dCB0aGUgY3VzdG9tZXIgbGlmZWN5Y2xlPC90ZD48L3RyPjx0cj48dGQgc3R5bGU9ImJvcmRlcjoxcHggc29saWQgI2UzZTZlYTtwYWRkaW5nOjEwcHggMTRweDt0ZXh0LWFsaWduOmxlZnQ7dmVydGljYWwtYWxpZ246dG9wIj5SZXZlbnVlIG1vZGVsPC90ZD48dGQgc3R5bGU9ImJvcmRlcjoxcHggc29saWQgI2UzZTZlYTtwYWRkaW5nOjEwcHggMTRweDt0ZXh0LWFsaWduOmxlZnQ7dmVydGljYWwtYWxpZ246dG9wIj5PbmUtdGltZSB0cmFuc2FjdGlvbjwvdGQ+PHRkIHN0eWxlPSJib3JkZXI6MXB4IHNvbGlkICNlM2U2ZWE7cGFkZGluZzoxMHB4IDE0cHg7dGV4dC1hbGlnbjpsZWZ0O3ZlcnRpY2FsLWFsaWduOnRvcCI+UmVjdXJyaW5nIHN1YnNjcmlwdGlvbiByZXZlbnVlPC90ZD48L3RyPjx0cj48dGQgc3R5bGU9ImJvcmRlcjoxcHggc29saWQgI2UzZTZlYTtwYWRkaW5nOjEwcHggMTRweDt0ZXh0LWFsaWduOmxlZnQ7dmVydGljYWwtYWxpZ246dG9wIj5LZXkgbWV0cmljPC90ZD48dGQgc3R5bGU9ImJvcmRlcjoxcHggc29saWQgI2UzZTZlYTtwYWRkaW5nOjEwcHggMTRweDt0ZXh0LWFsaWduOmxlZnQ7dmVydGljYWwtYWxpZ246dG9wIj5Db252ZXJzaW9uIHJhdGUgYW5kIGNvbXBsZXRlZCBzYWxlczwvdGQ+PHRkIHN0eWxlPSJib3JkZXI6MXB4IHNvbGlkICNlM2U2ZWE7cGFkZGluZzoxMHB4IDE0cHg7dGV4dC1hbGlnbjpsZWZ0O3ZlcnRpY2FsLWFsaWduOnRvcCI+UmV0ZW50aW9uLCBleHBhbnNpb24sIGFuZCBjdXN0b21lciBsaWZldGltZSB2YWx1ZSAoTFRWKTwvdGQ+PC90cj48dHI+PHRkIHN0eWxlPSJib3JkZXI6MXB4IHNvbGlkICNlM2U2ZWE7cGFkZGluZzoxMHB4IDE0cHg7dGV4dC1hbGlnbjpsZWZ0O3ZlcnRpY2FsLWFsaWduOnRvcCI+T25ib2FyZGluZzwvdGQ+PHRkIHN0eWxlPSJib3JkZXI6MXB4IHNvbGlkICNlM2U2ZWE7cGFkZGluZzoxMHB4IDE0cHg7dGV4dC1hbGlnbjpsZWZ0O3ZlcnRpY2FsLWFsaWduOnRvcCI+T3B0aW9uYWwgb3IgbWluaW1hbDwvdGQ+PHRkIHN0eWxlPSJib3JkZXI6MXB4IHNvbGlkICNlM2U2ZWE7cGFkZGluZzoxMHB4IDE0cHg7dGV4dC1hbGlnbjpsZWZ0O3ZlcnRpY2FsLWFsaWduOnRvcCI+Q3JpdGljYWwgZm9yIGxvbmctdGVybSBjdXN0b21lciBzdWNjZXNzPC90ZD48L3RyPjx0cj48dGQgc3R5bGU9ImJvcmRlcjoxcHggc29saWQgI2UzZTZlYTtwYWRkaW5nOjEwcHggMTRweDt0ZXh0LWFsaWduOmxlZnQ7dmVydGljYWwtYWxpZ246dG9wIj5Qb3N0LXB1cmNoYXNlIGVuZ2FnZW1lbnQ8L3RkPjx0ZCBzdHlsZT0iYm9yZGVyOjFweCBzb2xpZCAjZTNlNmVhO3BhZGRpbmc6MTBweCAxNHB4O3RleHQtYWxpZ246bGVmdDt2ZXJ0aWNhbC1hbGlnbjp0b3AiPkxpbWl0ZWQgYWZ0ZXIgdGhlIHNhbGU8L3RkPjx0ZCBzdHlsZT0iYm9yZGVyOjFweCBzb2xpZCAjZTNlNmVhO3BhZGRpbmc6MTBweCAxNHB4O3RleHQtYWxpZ246bGVmdDt2ZXJ0aWNhbC1hbGlnbjp0b3AiPk9uZ29pbmcgZW5nYWdlbWVudCBpcyBjZW50cmFsIHRvIHN1Y2Nlc3M8L3RkPjwvdHI+PHRyPjx0ZCBzdHlsZT0iYm9yZGVyOjFweCBzb2xpZCAjZTNlNmVhO3BhZGRpbmc6MTBweCAxNHB4O3RleHQtYWxpZ246bGVmdDt2ZXJ0aWNhbC1hbGlnbjp0b3AiPkN1c3RvbWVyIHJlbGF0aW9uc2hpcDwvdGQ+PHRkIHN0eWxlPSJib3JkZXI6MXB4IHNvbGlkICNlM2U2ZWE7cGFkZGluZzoxMHB4IDE0cHg7dGV4dC1hbGlnbjpsZWZ0O3ZlcnRpY2FsLWFsaWduOnRvcCI+UHJpbWFyaWx5IHRyYW5zYWN0aW9uYWw8L3RkPjx0ZCBzdHlsZT0iYm9yZGVyOjFweCBzb2xpZCAjZTNlNmVhO3BhZGRpbmc6MTBweCAxNHB4O3RleHQtYWxpZ246bGVmdDt2ZXJ0aWNhbC1hbGlnbjp0b3AiPkxvbmctdGVybSBwYXJ0bmVyc2hpcCBmb2N1c2VkIG9uIHZhbHVlIGRlbGl2ZXJ5PC90ZD48L3RyPjx0cj48dGQgc3R5bGU9ImJvcmRlcjoxcHggc29saWQgI2UzZTZlYTtwYWRkaW5nOjEwcHggMTRweDt0ZXh0LWFsaWduOmxlZnQ7dmVydGljYWwtYWxpZ246dG9wIj5DaHVybiByaXNrPC90ZD48dGQgc3R5bGU9ImJvcmRlcjoxcHggc29saWQgI2UzZTZlYTtwYWRkaW5nOjEwcHggMTRweDt0ZXh0LWFsaWduOmxlZnQ7dmVydGljYWwtYWxpZ246dG9wIj5SZWxhdGl2ZWx5IHVuY29tbW9uPC90ZD48dGQgc3R5bGU9ImJvcmRlcjoxcHggc29saWQgI2UzZTZlYTtwYWRkaW5nOjEwcHggMTRweDt0ZXh0LWFsaWduOmxlZnQ7dmVydGljYWwtYWxpZ246dG9wIj5Db250aW51b3VzIHJpc2sgdGhhdCBtdXN0IGJlIGFjdGl2ZWx5IG1hbmFnZWQ8L3RkPjwvdHI+PHRyPjx0ZCBzdHlsZT0iYm9yZGVyOjFweCBzb2xpZCAjZTNlNmVhO3BhZGRpbmc6MTBweCAxNHB4O3RleHQtYWxpZ246bGVmdDt2ZXJ0aWNhbC1hbGlnbjp0b3AiPlVwc2VsbCAvIGV4cGFuc2lvbjwvdGQ+PHRkIHN0eWxlPSJib3JkZXI6MXB4IHNvbGlkICNlM2U2ZWE7cGFkZGluZzoxMHB4IDE0cHg7dGV4dC1hbGlnbjpsZWZ0O3ZlcnRpY2FsLWFsaWduOnRvcCI+T2NjYXNpb25hbCBvbmUtdGltZSB1cHNlbGwgb3Bwb3J0dW5pdGllczwvdGQ+PHRkIHN0eWxlPSJib3JkZXI6MXB4IHNvbGlkICNlM2U2ZWE7cGFkZGluZzoxMHB4IDE0cHg7dGV4dC1hbGlnbjpsZWZ0O3ZlcnRpY2FsLWFsaWduOnRvcCI+Q29udGludW91cyBvcHBvcnR1bml0aWVzIGZvciBleHBhbnNpb24gYW5kIGFjY291bnQgZ3Jvd3RoPC90ZD48L3RyPjx0cj48dGQgc3R5bGU9ImJvcmRlcjoxcHggc29saWQgI2UzZTZlYTtwYWRkaW5nOjEwcHggMTRweDt0ZXh0LWFsaWduOmxlZnQ7dmVydGljYWwtYWxpZ246dG9wIj5TdWNjZXNzIG1lYXN1cmVtZW50PC90ZD48dGQgc3R5bGU9ImJvcmRlcjoxcHggc29saWQgI2UzZTZlYTtwYWRkaW5nOjEwcHggMTRweDt0ZXh0LWFsaWduOmxlZnQ7dmVydGljYWwtYWxpZ246dG9wIj5XaGV0aGVyIHRoZSBzYWxlIHdhcyBjb21wbGV0ZWQ8L3RkPjx0ZCBzdHlsZT0iYm9yZGVyOjFweCBzb2xpZCAjZTNlNmVhO3BhZGRpbmc6MTBweCAxNHB4O3RleHQtYWxpZ246bGVmdDt2ZXJ0aWNhbC1hbGlnbjp0b3AiPldoZXRoZXIgY3VzdG9tZXJzIGNvbnRpbnVlIHRvIHJlYWxpemUgdmFsdWUgb3ZlciB0aW1lPC90ZD48L3RyPjwvdGJvZHk+PC90YWJsZT48L2Rpdj4=]]
The critical insight: in SaaS, the sale is the beginning of the relationship, not the end. Everything after purchase (onboarding, engagement, renewal, expansion) matters more than the initial conversion for long-term revenue.
The 6-Stage SaaS Customer Journey Framework
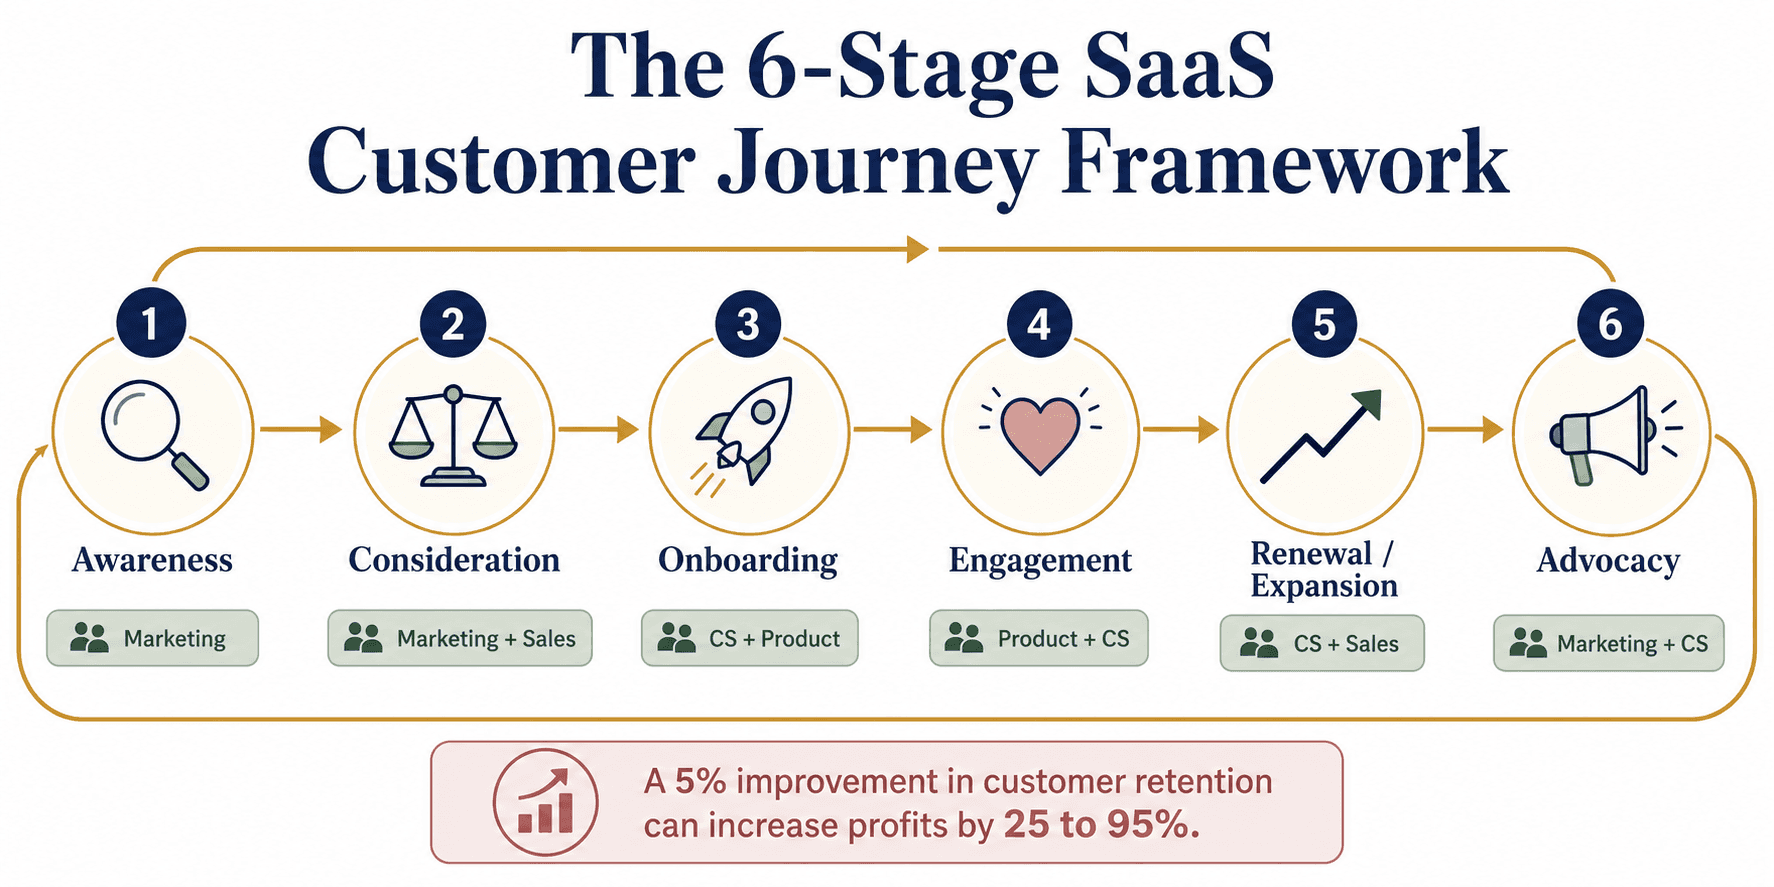
Circular flow infographic showing the 6-stage SaaS customer journey framework with team ownership and a retention profit statistic.
Use this 6-stage framework to structure your SaaS customer journey map.
[[EMBED:PGRpdiBzdHlsZT0ib3ZlcmZsb3cteDphdXRvO21hcmdpbjoyMHB4IDAiPjx0YWJsZSBzdHlsZT0id2lkdGg6MTAwJTtib3JkZXItY29sbGFwc2U6Y29sbGFwc2U7Zm9udC1zaXplOjE1cHg7bWFyZ2luOjhweCAwIj48dGggc3R5bGU9ImJvcmRlcjoxcHggc29saWQgI2UzZTZlYTtwYWRkaW5nOjEwcHggMTRweDt0ZXh0LWFsaWduOmxlZnQ7YmFja2dyb3VuZDojZjRmNmY4O2ZvbnQtd2VpZ2h0OjYwMCI+PHRyPjx0aCBzdHlsZT0iYm9yZGVyOjFweCBzb2xpZCAjZTNlNmVhO3BhZGRpbmc6MTBweCAxNHB4O3RleHQtYWxpZ246bGVmdDtiYWNrZ3JvdW5kOiNmNGY2Zjg7Zm9udC13ZWlnaHQ6NjAwIj5TdGFnZTwvdGg+PHRoIHN0eWxlPSJib3JkZXI6MXB4IHNvbGlkICNlM2U2ZWE7cGFkZGluZzoxMHB4IDE0cHg7dGV4dC1hbGlnbjpsZWZ0O2JhY2tncm91bmQ6I2Y0ZjZmODtmb250LXdlaWdodDo2MDAiPldoYXQgSXQgQ292ZXJzPC90aD48dGggc3R5bGU9ImJvcmRlcjoxcHggc29saWQgI2UzZTZlYTtwYWRkaW5nOjEwcHggMTRweDt0ZXh0LWFsaWduOmxlZnQ7YmFja2dyb3VuZDojZjRmNmY4O2ZvbnQtd2VpZ2h0OjYwMCI+UHJpbWFyeSBUZWFtIEZvY3VzPC90aD48L3RyPjwvdGhlYWQ+PHRib2R5Pjx0cj48dGQgc3R5bGU9ImJvcmRlcjoxcHggc29saWQgI2UzZTZlYTtwYWRkaW5nOjEwcHggMTRweDt0ZXh0LWFsaWduOmxlZnQ7dmVydGljYWwtYWxpZ246dG9wIj4xLiBBd2FyZW5lc3M8L3RkPjx0ZCBzdHlsZT0iYm9yZGVyOjFweCBzb2xpZCAjZTNlNmVhO3BhZGRpbmc6MTBweCAxNHB4O3RleHQtYWxpZ246bGVmdDt2ZXJ0aWNhbC1hbGlnbjp0b3AiPlRoZSBjdXN0b21lciBmaXJzdCBkaXNjb3ZlcnMgdGhlIHByb2R1Y3Qgb3IgYnJhbmQ8L3RkPjx0ZCBzdHlsZT0iYm9yZGVyOjFweCBzb2xpZCAjZTNlNmVhO3BhZGRpbmc6MTBweCAxNHB4O3RleHQtYWxpZ246bGVmdDt2ZXJ0aWNhbC1hbGlnbjp0b3AiPk1hcmtldGluZzwvdGQ+PC90cj48dHI+PHRkIHN0eWxlPSJib3JkZXI6MXB4IHNvbGlkICNlM2U2ZWE7cGFkZGluZzoxMHB4IDE0cHg7dGV4dC1hbGlnbjpsZWZ0O3ZlcnRpY2FsLWFsaWduOnRvcCI+Mi4gQ29uc2lkZXJhdGlvbjwvdGQ+PHRkIHN0eWxlPSJib3JkZXI6MXB4IHNvbGlkICNlM2U2ZWE7cGFkZGluZzoxMHB4IDE0cHg7dGV4dC1hbGlnbjpsZWZ0O3ZlcnRpY2FsLWFsaWduOnRvcCI+VGhlIGN1c3RvbWVyIGNvbXBhcmVzIHRoZSBwcm9kdWN0IHdpdGggY29tcGV0aXRvcnMgYW5kIGV2YWx1YXRlcyBvcHRpb25zPC90ZD48dGQgc3R5bGU9ImJvcmRlcjoxcHggc29saWQgI2UzZTZlYTtwYWRkaW5nOjEwcHggMTRweDt0ZXh0LWFsaWduOmxlZnQ7dmVydGljYWwtYWxpZ246dG9wIj5NYXJrZXRpbmcgKyBTYWxlczwvdGQ+PC90cj48dHI+PHRkIHN0eWxlPSJib3JkZXI6MXB4IHNvbGlkICNlM2U2ZWE7cGFkZGluZzoxMHB4IDE0cHg7dGV4dC1hbGlnbjpsZWZ0O3ZlcnRpY2FsLWFsaWduOnRvcCI+My4gT25ib2FyZGluZzwvdGQ+PHRkIHN0eWxlPSJib3JkZXI6MXB4IHNvbGlkICNlM2U2ZWE7cGFkZGluZzoxMHB4IDE0cHg7dGV4dC1hbGlnbjpsZWZ0O3ZlcnRpY2FsLWFsaWduOnRvcCI+VGhlIGN1c3RvbWVyIHNldHMgdXAgdGhlIHByb2R1Y3QgYW5kIGJlZ2lucyB1c2luZyBpdCBzdWNjZXNzZnVsbHk8L3RkPjx0ZCBzdHlsZT0iYm9yZGVyOjFweCBzb2xpZCAjZTNlNmVhO3BhZGRpbmc6MTBweCAxNHB4O3RleHQtYWxpZ246bGVmdDt2ZXJ0aWNhbC1hbGlnbjp0b3AiPkN1c3RvbWVyIFN1Y2Nlc3MgKyBQcm9kdWN0PC90ZD48L3RyPjx0cj48dGQgc3R5bGU9ImJvcmRlcjoxcHggc29saWQgI2UzZTZlYTtwYWRkaW5nOjEwcHggMTRweDt0ZXh0LWFsaWduOmxlZnQ7dmVydGljYWwtYWxpZ246dG9wIj40LiBFbmdhZ2VtZW50PC90ZD48dGQgc3R5bGU9ImJvcmRlcjoxcHggc29saWQgI2UzZTZlYTtwYWRkaW5nOjEwcHggMTRweDt0ZXh0LWFsaWduOmxlZnQ7dmVydGljYWwtYWxpZ246dG9wIj5UaGUgY3VzdG9tZXIgcmVndWxhcmx5IHVzZXMgdGhlIHByb2R1Y3QgYW5kIGdhaW5zIG9uZ29pbmcgdmFsdWU8L3RkPjx0ZCBzdHlsZT0iYm9yZGVyOjFweCBzb2xpZCAjZTNlNmVhO3BhZGRpbmc6MTBweCAxNHB4O3RleHQtYWxpZ246bGVmdDt2ZXJ0aWNhbC1hbGlnbjp0b3AiPlByb2R1Y3QgKyBDdXN0b21lciBTdWNjZXNzPC90ZD48L3RyPjx0cj48dGQgc3R5bGU9ImJvcmRlcjoxcHggc29saWQgI2UzZTZlYTtwYWRkaW5nOjEwcHggMTRweDt0ZXh0LWFsaWduOmxlZnQ7dmVydGljYWwtYWxpZ246dG9wIj41LiBSZW5ld2FsIC8gRXhwYW5zaW9uPC90ZD48dGQgc3R5bGU9ImJvcmRlcjoxcHggc29saWQgI2UzZTZlYTtwYWRkaW5nOjEwcHggMTRweDt0ZXh0LWFsaWduOmxlZnQ7dmVydGljYWwtYWxpZ246dG9wIj5UaGUgY3VzdG9tZXIgcmVuZXdzLCB1cGdyYWRlcywgZXhwYW5kcyB1c2FnZSwgb3IgZGVjaWRlcyB0byBjaHVybjwvdGQ+PHRkIHN0eWxlPSJib3JkZXI6MXB4IHNvbGlkICNlM2U2ZWE7cGFkZGluZzoxMHB4IDE0cHg7dGV4dC1hbGlnbjpsZWZ0O3ZlcnRpY2FsLWFsaWduOnRvcCI+Q3VzdG9tZXIgU3VjY2VzcyArIFNhbGVzPC90ZD48L3RyPjx0cj48dGQgc3R5bGU9ImJvcmRlcjoxcHggc29saWQgI2UzZTZlYTtwYWRkaW5nOjEwcHggMTRweDt0ZXh0LWFsaWduOmxlZnQ7dmVydGljYWwtYWxpZ246dG9wIj42LiBBZHZvY2FjeTwvdGQ+PHRkIHN0eWxlPSJib3JkZXI6MXB4IHNvbGlkICNlM2U2ZWE7cGFkZGluZzoxMHB4IDE0cHg7dGV4dC1hbGlnbjpsZWZ0O3ZlcnRpY2FsLWFsaWduOnRvcCI+VGhlIGN1c3RvbWVyIHJlY29tbWVuZHMgdGhlIHByb2R1Y3QgdGhyb3VnaCByZWZlcnJhbHMsIHJldmlld3MsIG9yIGNhc2Ugc3R1ZGllczwvdGQ+PHRkIHN0eWxlPSJib3JkZXI6MXB4IHNvbGlkICNlM2U2ZWE7cGFkZGluZzoxMHB4IDE0cHg7dGV4dC1hbGlnbjpsZWZ0O3ZlcnRpY2FsLWFsaWduOnRvcCI+TWFya2V0aW5nICsgQ3VzdG9tZXIgU3VjY2VzczwvdGQ+PC90cj48L3Rib2R5PjwvdGFibGU+PC9kaXY+]]
Deep Dive Into Each Stage
1. Awareness
The journey begins when a potential customer first discovers your SaaS product. Marketing owns this stage.
Key activities:
Content marketing (blogs, guides, case studies)
SEO and organic search
Paid advertising (search, social, display)
Social media and community-led marketing
Partnerships and referrals
Goal: get the right people to know your product exists and understand what problem it solves.
Key metrics: website traffic, brand search volume, content engagement, cost per lead.
For related marketing frameworks, see our guides on effective marketing strategies, content marketing examples for lead generation, and 11 marketing tips for startups.
2. Consideration
The prospect knows you exist. Now they’re deciding whether you’re the right choice. Marketing and Sales share this stage.
Key activities:
Product demos and free trials
Comparison content (“vs. competitor” pages, alternatives content)
Case studies and social proof
Sales conversations and follow-up
Pricing transparency
Free-tier or freemium experience
Goal: move qualified prospects toward a decision by clearly demonstrating fit, value, and differentiation.
Key metrics: demo requests, trial signups, sales cycle length, conversion rate from trial to paid.
For related content, see our guides on b2b sales, the sales process, and sales strategy.
3. Onboarding
The customer has decided to try or buy. Now the clock is ticking. This is the highest-stakes stage in the SaaS journey because a bad onboarding experience creates immediate churn risk. Customer Success and Product own this stage.
Key activities:
Guided setup and account configuration
Product tours and walkthroughs
Personalized welcome emails and outreach
Educational content (help docs, tutorials, videos)
Early check-ins from a Customer Success Manager
Milestone celebrations (first action, first invite, first success)
Goal: get the customer to first value (their first “aha moment”) as fast as possible.
Key metrics: time to first value, activation rate, onboarding completion, early churn.
4. Engagement
The customer is now using the product day-to-day. This is the longest and most critical stage in the SaaS journey. Product and Customer Success collaborate to keep customers engaged and finding new value.
Key activities:
Feature adoption campaigns
Product updates and release notes
In-app messaging and nudges
Quarterly business reviews (QBRs) for enterprise accounts
Customer support and success outreach
Community building (user groups, forums, events)
Goal: deepen product usage, uncover expansion opportunities, and build habitual engagement.
Key metrics: DAU/MAU ratio, feature adoption, NPS, customer satisfaction, support ticket volume.
5. Renewal or Expansion
The customer approaches renewal or expansion decisions. The value they’ve received over the past year determines the outcome. Customer Success and Sales work together.
Key activities:
Value reviews and ROI reporting
Renewal outreach with proactive relationship management
Expansion conversations (upgrades, additional seats, new modules)
Handling churn risks proactively
Contract negotiation
Goal: retain the customer and (ideally) expand the relationship.
Key metrics: gross retention, net retention, expansion revenue, renewal rate, churn rate.
For related sales and expansion content, see our guide on sales prospecting and customer trust strategies.
6. Advocacy
Satisfied long-term customers become promoters. Advocacy is where great customer journeys generate exponential returns. Marketing and Customer Success capitalize on this stage.
Key activities:
Referral programs
Customer testimonials and case studies
User-generated content
Reviews on G2, Capterra, and industry platforms
Speaking opportunities at conferences
Community leadership programs
Goal: turn happy customers into a growth channel for the business.
Key metrics: referral revenue, review volume, NPS, customer-generated content.
How to Create a SaaS Customer Journey Map Step by Step
Building a journey map isn’t a one-hour exercise. Done properly, it’s a cross-functional project that takes days or weeks. Here’s the step-by-step process.
Step 1: Define Your Customer Personas
Identify the different types of users who interact with your product. Common SaaS personas include:
End users (the people using the tool day-to-day)
Buyers or decision-makers (people who approve the purchase, especially in B2B)
Champions (internal advocates who promote adoption)
Admins (people who configure and manage the account)
For B2B SaaS, journey maps often need to cover multiple personas simultaneously because different roles engage with the product at different stages. See our guide on segmentation and targeting.
Step 2: Identify Key Stages
Break the journey into the 6 stages above: Awareness, Consideration, Onboarding, Engagement, Renewal/Expansion, and Advocacy. Some companies add sub-stages (like “trial” separate from “onboarding”) depending on their funnel structure.
Step 3: Map Customer Touchpoints
For each stage and persona, list every touchpoint where the customer interacts with your brand or product:
Website visits and content consumption
Emails and marketing communications
Sales conversations and demos
Product usage moments
Customer support interactions
In-app notifications
Renewal and billing communications
The more granular the touchpoints, the more actionable the map.
Step 4: Analyze Customer Emotions and Pain Points
At each touchpoint, ask three questions:
What is the customer trying to achieve here?
Where might they feel frustration or confusion?
What could increase satisfaction and success?
Gather data through customer interviews, support ticket analysis, NPS surveys, and product usage analytics.
Step 5: Set Key Metrics for Each Stage
Every stage needs measurable success criteria. See the “Key Metrics for Each Journey Stage” table below for common KPIs.
Step 6: Collaborate Across Teams
Journey mapping requires input from product, marketing, sales, customer success, and support. Each team brings a different lens to the same customer experience. Regular working sessions surface insights no single team would produce alone. A SaaS development company may involve these teams throughout the process, with regular working sessions helping uncover insights from different parts of the customer journey.
Step 7: Visualize the Journey
Turn the analysis into a visual map. This is where a tool like Decktopus AI becomes essential. A well-designed journey map deck communicates the full customer experience to executives, board members, and other stakeholders in a way that a spreadsheet never can.
Step 8: Implement, Measure, and Iterate
Journey maps aren’t documents you build once and file away. They’re living systems. Test changes based on the map, measure the impact, and refine continuously.
Key Metrics for Each Journey Stage
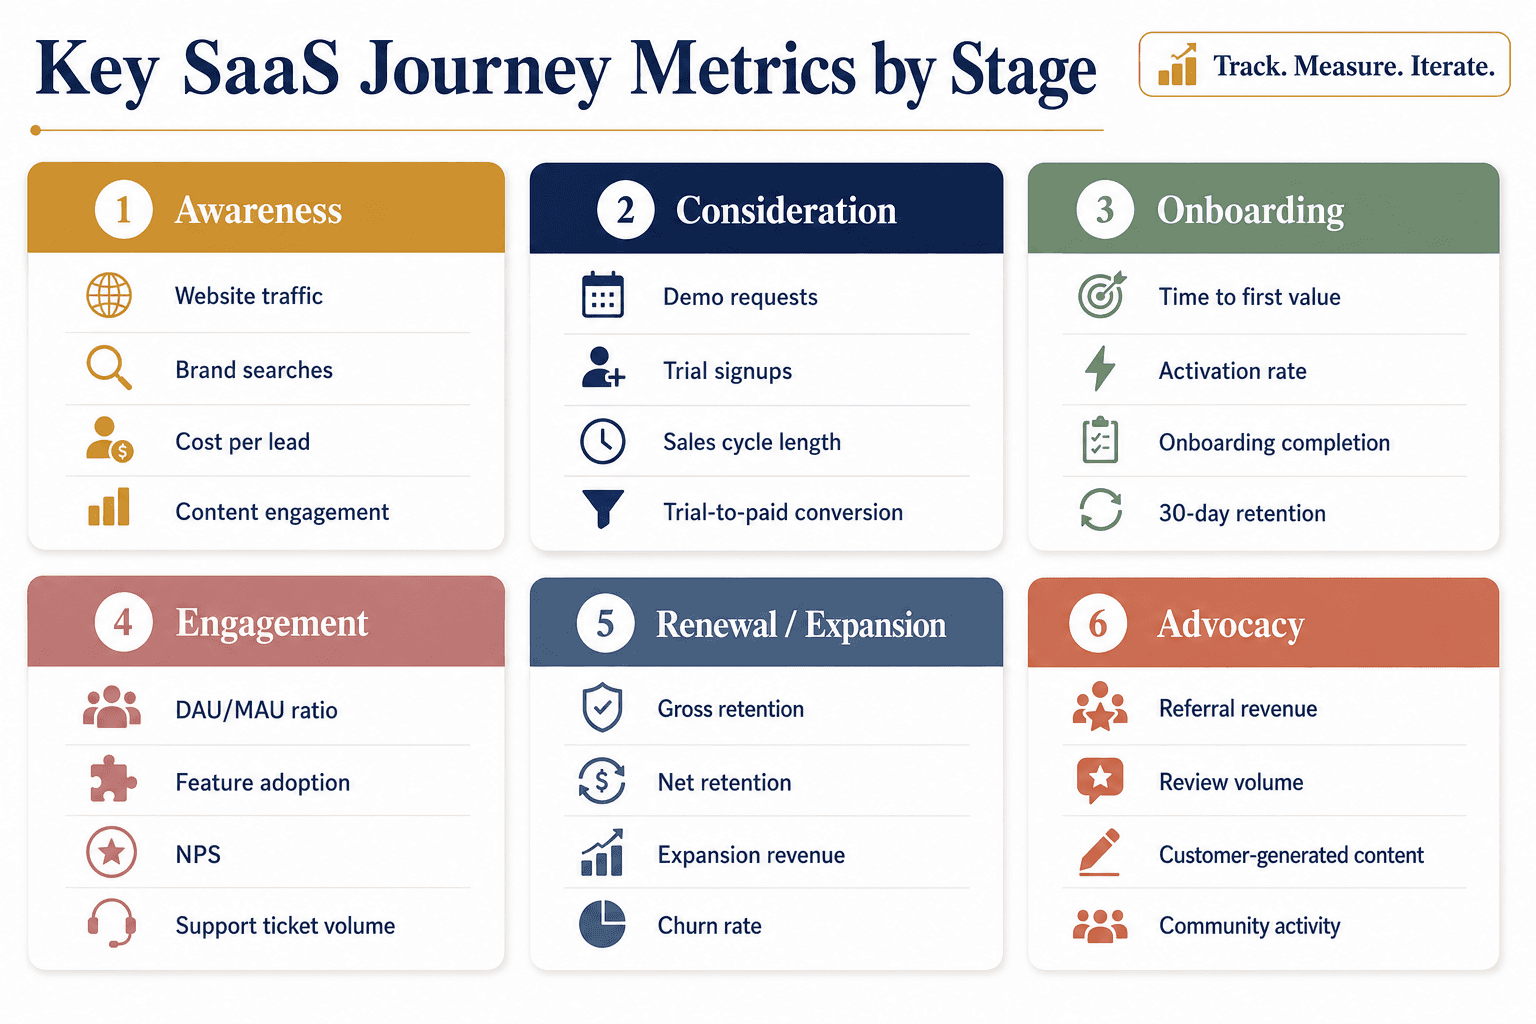
Dashboard-style infographic showing 4 key metrics for each of the 6 SaaS customer journey stages, organized in a 3x2 grid of stage cards.
Track the right metrics at each stage to understand whether the journey is delivering results.
[[EMBED:PGRpdiBzdHlsZT0ib3ZlcmZsb3cteDphdXRvO21hcmdpbjoyMHB4IDAiPjx0YWJsZSBzdHlsZT0id2lkdGg6MTAwJTtib3JkZXItY29sbGFwc2U6Y29sbGFwc2U7Zm9udC1zaXplOjE1cHg7bWFyZ2luOjhweCAwIj48dGggc3R5bGU9ImJvcmRlcjoxcHggc29saWQgI2UzZTZlYTtwYWRkaW5nOjEwcHggMTRweDt0ZXh0LWFsaWduOmxlZnQ7YmFja2dyb3VuZDojZjRmNmY4O2ZvbnQtd2VpZ2h0OjYwMCI+PHRyPjx0aCBzdHlsZT0iYm9yZGVyOjFweCBzb2xpZCAjZTNlNmVhO3BhZGRpbmc6MTBweCAxNHB4O3RleHQtYWxpZ246bGVmdDtiYWNrZ3JvdW5kOiNmNGY2Zjg7Zm9udC13ZWlnaHQ6NjAwIj5TdGFnZTwvdGg+PHRoIHN0eWxlPSJib3JkZXI6MXB4IHNvbGlkICNlM2U2ZWE7cGFkZGluZzoxMHB4IDE0cHg7dGV4dC1hbGlnbjpsZWZ0O2JhY2tncm91bmQ6I2Y0ZjZmODtmb250LXdlaWdodDo2MDAiPlByaW1hcnkgTWV0cmljczwvdGg+PC90cj48L3RoZWFkPjx0Ym9keT48dHI+PHRkIHN0eWxlPSJib3JkZXI6MXB4IHNvbGlkICNlM2U2ZWE7cGFkZGluZzoxMHB4IDE0cHg7dGV4dC1hbGlnbjpsZWZ0O3ZlcnRpY2FsLWFsaWduOnRvcCI+QXdhcmVuZXNzPC90ZD48dGQgc3R5bGU9ImJvcmRlcjoxcHggc29saWQgI2UzZTZlYTtwYWRkaW5nOjEwcHggMTRweDt0ZXh0LWFsaWduOmxlZnQ7dmVydGljYWwtYWxpZ246dG9wIj5XZWJzaXRlIHRyYWZmaWMsIGJyYW5kIHNlYXJjaCB2b2x1bWUsIGNvbnRlbnQgZW5nYWdlbWVudCwgYW5kIGNvc3QgcGVyIGxlYWQ8L3RkPjwvdHI+PHRyPjx0ZCBzdHlsZT0iYm9yZGVyOjFweCBzb2xpZCAjZTNlNmVhO3BhZGRpbmc6MTBweCAxNHB4O3RleHQtYWxpZ246bGVmdDt2ZXJ0aWNhbC1hbGlnbjp0b3AiPkNvbnNpZGVyYXRpb248L3RkPjx0ZCBzdHlsZT0iYm9yZGVyOjFweCBzb2xpZCAjZTNlNmVhO3BhZGRpbmc6MTBweCAxNHB4O3RleHQtYWxpZ246bGVmdDt2ZXJ0aWNhbC1hbGlnbjp0b3AiPkRlbW8gcmVxdWVzdHMsIHRyaWFsIHNpZ251cHMsIHNhbGVzIGN5Y2xlIGxlbmd0aCwgYW5kIHRyaWFsLXRvLXBhaWQgY29udmVyc2lvbiByYXRlPC90ZD48L3RyPjx0cj48dGQgc3R5bGU9ImJvcmRlcjoxcHggc29saWQgI2UzZTZlYTtwYWRkaW5nOjEwcHggMTRweDt0ZXh0LWFsaWduOmxlZnQ7dmVydGljYWwtYWxpZ246dG9wIj5PbmJvYXJkaW5nPC90ZD48dGQgc3R5bGU9ImJvcmRlcjoxcHggc29saWQgI2UzZTZlYTtwYWRkaW5nOjEwcHggMTRweDt0ZXh0LWFsaWduOmxlZnQ7dmVydGljYWwtYWxpZ246dG9wIj5UaW1lIHRvIGZpcnN0IHZhbHVlLCBhY3RpdmF0aW9uIHJhdGUsIG9uYm9hcmRpbmcgY29tcGxldGlvbiwgYW5kIDMwLWRheSByZXRlbnRpb248L3RkPjwvdHI+PHRyPjx0ZCBzdHlsZT0iYm9yZGVyOjFweCBzb2xpZCAjZTNlNmVhO3BhZGRpbmc6MTBweCAxNHB4O3RleHQtYWxpZ246bGVmdDt2ZXJ0aWNhbC1hbGlnbjp0b3AiPkVuZ2FnZW1lbnQ8L3RkPjx0ZCBzdHlsZT0iYm9yZGVyOjFweCBzb2xpZCAjZTNlNmVhO3BhZGRpbmc6MTBweCAxNHB4O3RleHQtYWxpZ246bGVmdDt2ZXJ0aWNhbC1hbGlnbjp0b3AiPkRBVS9NQVUgcmF0aW8sIGZlYXR1cmUgYWRvcHRpb24gcmF0ZSwgTmV0IFByb21vdGVyIFNjb3JlIChOUFMpLCBDdXN0b21lciBTYXRpc2ZhY3Rpb24gU2NvcmUgKENTQVQpLCBhbmQgc3VwcG9ydCB0aWNrZXQgdm9sdW1lPC90ZD48L3RyPjx0cj48dGQgc3R5bGU9ImJvcmRlcjoxcHggc29saWQgI2UzZTZlYTtwYWRkaW5nOjEwcHggMTRweDt0ZXh0LWFsaWduOmxlZnQ7dmVydGljYWwtYWxpZ246dG9wIj5SZW5ld2FsIC8gRXhwYW5zaW9uPC90ZD48dGQgc3R5bGU9ImJvcmRlcjoxcHggc29saWQgI2UzZTZlYTtwYWRkaW5nOjEwcHggMTRweDt0ZXh0LWFsaWduOmxlZnQ7dmVydGljYWwtYWxpZ246dG9wIj5Hcm9zcyByZXRlbnRpb24sIG5ldCByZXRlbnRpb24sIGV4cGFuc2lvbiByZXZlbnVlLCBhbmQgY2h1cm4gcmF0ZTwvdGQ+PC90cj48dHI+PHRkIHN0eWxlPSJib3JkZXI6MXB4IHNvbGlkICNlM2U2ZWE7cGFkZGluZzoxMHB4IDE0cHg7dGV4dC1hbGlnbjpsZWZ0O3ZlcnRpY2FsLWFsaWduOnRvcCI+QWR2b2NhY3k8L3RkPjx0ZCBzdHlsZT0iYm9yZGVyOjFweCBzb2xpZCAjZTNlNmVhO3BhZGRpbmc6MTBweCAxNHB4O3RleHQtYWxpZ246bGVmdDt2ZXJ0aWNhbC1hbGlnbjp0b3AiPlJlZmVycmFsIHJldmVudWUsIHJldmlldyB2b2x1bWUsIE5ldCBQcm9tb3RlciBTY29yZSAoTlBTKSwgY3VzdG9tZXItZ2VuZXJhdGVkIGNvbnRlbnQsIGFuZCBjb21tdW5pdHkgYWN0aXZpdHk8L3RkPjwvdHI+PC90Ym9keT48L3RhYmxlPjwvZGl2Pg==]]
Real-World SaaS Journey Case Studies
Studying how successful SaaS companies optimize their journeys accelerates your own thinking.
1. Gong: Driving Sales With Data Insights
Gong helps its customers (including Drift) leverage deep data insights to improve sales conversations. By capturing and analyzing customer interactions, Gong enables companies to make data-driven decisions, resulting in higher sales engagement and retention. Drift used Gong’s platform to streamline its sales strategy, leading to quantifiable improvements in conversion rates.
Key takeaway: identify the specific moment in the customer journey where data insights create the most value, then build features around that moment.
2. Heap: Increasing Retention and Conversion
Heap’s platform provided THINX, a company in the personal care industry, with actionable data leading to a 5x increase in conversions and a 90% retention rate. By helping THINX optimize its user flows and identify friction points, Heap enabled the company to refine its customer onboarding and support processes.
Key takeaway: the customer journey often looks fine from the inside. Real behavioral data usually surfaces problems no one on the team noticed.
3. Notion: Coordinating Team Goals and Objectives
Notion’s flexible collaboration tool allowed teams to streamline project management and align personal goals with team objectives. By creating customized databases and workflows, users improved internal communication and efficiency, which in turn increased engagement and long-term retention.
Key takeaway: in SaaS, flexibility can be a feature or a bug. Great journeys guide new users to a starting point instead of leaving them staring at a blank canvas.
4. Postman: Enhancing Developer Experience
Postman’s API development platform enabled eCommerce businesses like Stripe and PayPal to handle development issues more efficiently. Postman improved the debugging process by providing tools that allowed for quick error replication and resolution. This helped reduce churn rates and boosted customer satisfaction by ensuring smoother user experiences.
Key takeaway: highly technical users have specific journey pain points (like debugging friction). Solving those pain points builds category leadership.
5. Ahrefs: Revolutionizing SEO Strategies
Ahrefs transformed how hosting companies managed their SEO efforts, helping companies discover new content opportunities and stay ahead of competition. By offering a full suite of tools for keyword research, backlink analysis, and content optimization, Ahrefs drove engagement and improved long-term customer retention.
Key takeaway: deep tool integration into a customer’s workflow creates switching costs that protect renewal rates.
Tools for Optimizing the SaaS Customer Journey
Different tools help at different stages of the journey. Here’s a practical overview.
Intercom (Customer Engagement and Support)
Intercom offers live chat, automated messaging, and support workflows. Strong for onboarding messages, in-app guidance, and support conversations across the journey.
Heap (Behavioral Analytics)
Heap automatically captures every customer interaction with your product. Excellent for identifying friction points, tracking user flows, and surfacing usage patterns that inform product decisions.
Pendo (Product Experience and Onboarding)
Pendo focuses on product adoption. In-app messaging, product walkthroughs, usage analytics, and customer feedback tools all in one platform.
HubSpot CRM (Customer Relationship Management)
Strong for tracking customer interactions across marketing, sales, and support touchpoints. Sales automation and customer lifecycle reporting.
Mixpanel (Product Analytics)
Deep event-based product analytics. Useful for measuring activation, retention, and cohort behavior over time.
Decktopus AI (Journey Map Presentation and Visualization)
For visualizing and communicating your SaaS customer journey to stakeholders, executives, or your own team, Decktopus AI generates full journey map presentations from a short description in minutes. It’s built specifically for creating clear, on-brand, presentation-ready decks that turn complex journey analysis into an easy-to-follow visual story. See the dedicated section below.
Expert Tips and Best Practices
1. Invest Heavily in Onboarding
Ensuring customers experience value quickly is the single highest-leverage investment in a SaaS journey. Use in-app guides, personalized walkthroughs, and success milestones to shorten time-to-value.
Example: Slack’s intuitive onboarding minimizes friction by letting users set up and start collaborating within minutes.
2. Use Data to Predict Churn
Monitor customer behavior for early signs of disengagement. Declining login frequency, feature usage drops, or reduced support engagement often precede churn by weeks. Set up early warning systems that alert customer success proactively.
3. Personalize the Journey at Every Stage
Segmentation and behavioral data let you tailor the experience based on real customer needs.
Example: Email tools like Mailchimp personalize email campaigns based on user preferences and behavior, lifting engagement and loyalty.
4. Leverage Automation for Timely Interactions
Automation ensures the right message reaches the customer at the right moment, whether it’s an onboarding nudge, a renewal reminder, or an upsell trigger. Platforms like Intercom automate these touchpoints without losing the personal feel.
5. Segment Personas to Tailor Your Approach
Not all customers are the same. B2B SaaS often has multiple personas within a single account. End users, admins, and executive buyers each need different journeys. Segmentation based on role, behavior, and usage patterns creates far more relevant touchpoints. See our guide on behavioral segmentation.
6. Close the Loop With Feedback
Every stage should generate feedback that informs the next iteration. NPS after onboarding. CSAT after support tickets. Product feedback in-app. Feedback that goes nowhere frustrates customers. Feedback that improves the product builds trust.
7. Build a Cross-Functional Journey Team
Journey mapping is a team sport. A cross-functional working group (product, marketing, sales, customer success, support) that meets regularly to review journey performance is one of the strongest operational patterns in high-growth SaaS.
8. Measure Both Behavior and Sentiment
Behavioral metrics (usage, retention) tell you what customers do. Sentiment metrics (NPS, CSAT) tell you how they feel. You need both to see the full picture.
9. Reinforce Value at Renewal
Renewals aren’t the moment to sell. They’re the moment to remind. Bring data-backed value stories, ROI summaries, and future roadmap into every renewal conversation.
10. Turn Advocacy Into a System
Great customer advocates don’t happen by accident. Systematize how you identify, nurture, and activate happy customers. Referral programs, review campaigns, and case study workflows all matter.
Common Mistakes to Avoid
Skipping onboarding investment. Companies that spend heavily on acquisition and treat onboarding as an afterthought produce high churn every time. Onboarding matters as much as any single stage.
One-size-fits-all messaging. Sending the same content to every customer regardless of stage or segment kills relevance. Segment and personalize.
No clear ownership per stage. When product, marketing, and customer success all “sort of” own onboarding, no one owns it. Assign one primary owner per stage.
Ignoring qualitative feedback. Analytics alone miss the “why.” Customer interviews, support ticket themes, and open-ended survey responses reveal what dashboards can’t.
Treating journey maps as documents, not tools. A journey map that sits in a Google Doc doesn’t drive change. It needs to be visible, referenced regularly, and updated as the business evolves.
Overcomplicating the framework. Journey maps with 40 sub-stages and 200 touchpoints become impossible to act on. Keep the framework clean enough to actually use.
Not aligning on metrics. If product, marketing, and customer success track different metrics for the same stage, teams drift out of alignment. Shared metrics matter.
Failing to iterate. Customer behavior changes. Competitor products evolve. Journey maps built two years ago rarely fit today’s reality. Review and update quarterly.
For related content, see our guides on the customer success lifecycle and customer service tips.
How to Build Your SaaS Customer Journey Deck with Decktopus AI
A SaaS customer journey map only creates value when it’s communicated clearly across teams, executives, and stakeholders. Decktopus AI generates a full SaaS customer journey deck from a short description in minutes, transforming complex journey analysis into a clear, presentation-ready visual story.
Why Decktopus AI Is Built for SaaS Journey Presentations
For SaaS teams that need to present customer journey maps, onboarding strategies, quarterly business reviews, and retention analyses on a regular cadence, Decktopus AI is the fastest way to produce polished, on-brand decks. Every feature below is confirmed and directly relevant to SaaS journey work.
AI-first creation from a prompt. Describe your journey topic in one sentence. Type “SaaS customer journey deck for a B2B analytics platform, focused on onboarding and expansion.” Decktopus AI generates a full structured deck with content, layout, and visuals in minutes. What used to take a Customer Success team an entire afternoon (or a day for polish) now takes 15 minutes end-to-end.
Automatic brand import from your website URL. For SaaS companies, brand consistency across QBRs, executive updates, and customer-facing decks is non-negotiable. Paste your company URL and Decktopus AI extracts your logo, colors, and fonts, then applies them across every slide automatically. Every journey map you produce is instantly on-brand. Agencies serving multiple SaaS clients or in-house teams juggling different brands find this feature transformative.
Beautify: refresh existing journey maps. If you have an older customer journey deck from last quarter or last year, upload it to Beautify. Decktopus AI either redesigns it fully with modern layouts and your current brand, or uses it as source material to build a fresh version. Ideal for teams updating quarterly QBR templates or refreshing outdated internal journey documentation.
Edit with AI: refine any slide with plain language. Once your journey deck is generated, refining it doesn’t require menu-hunting. Click Edit with AI and type instructions:
“Add a slide showing time-to-value benchmarks”
“Make the onboarding stage more visual with a step-by-step flow”
“Add a metrics comparison table for retention across segments”
“Add a churn risk indicator chart for the engagement stage”
Every edit is tracked in unlimited version history, so you can compare versions and revert if needed.
Loop AI Delivery Coach. For customer success leaders and product managers presenting journey findings to executives or boards, Loop AI Delivery Coach is a unique advantage. Rehearse your journey deck and get real-time feedback on pacing, filler words, and clarity before your actual QBR or board meeting. No other major presentation tool offers this.
Live-link sharing with auto-update. Share your customer journey deck via a live link with your product team, customer success team, or executives. Any updates you make afterward (new metrics, refined touchpoints, updated personas) automatically appear at the same URL. Everyone always sees the latest version without you having to re-send updated files. This is especially valuable for journey maps that get referenced regularly across the org.
AI Carousel Maker. Turn your customer journey insights into native LinkedIn or Instagram carousels styled to your brand. Great for thought leadership content, sharing journey learnings publicly, or promoting your customer success expertise.
PDF import. Upload an existing PDF of customer research, journey documentation, or persona work and Decktopus AI converts it into an editable deck you can then refine and expand.
Multi-format export. Download as PDF, PPT, or PNG depending on how you plan to share.
Decktopus AI vs. Other Presentation Tools for SaaS Journey Work
[[EMBED:PGRpdiBzdHlsZT0ib3ZlcmZsb3cteDphdXRvO21hcmdpbjoyMHB4IDAiPjx0YWJsZSBzdHlsZT0id2lkdGg6MTAwJTtib3JkZXItY29sbGFwc2U6Y29sbGFwc2U7Zm9udC1zaXplOjE1cHg7bWFyZ2luOjhweCAwIj48dGggc3R5bGU9ImJvcmRlcjoxcHggc29saWQgI2UzZTZlYTtwYWRkaW5nOjEwcHggMTRweDt0ZXh0LWFsaWduOmxlZnQ7YmFja2dyb3VuZDojZjRmNmY4O2ZvbnQtd2VpZ2h0OjYwMCI+PHRyPjx0aCBzdHlsZT0iYm9yZGVyOjFweCBzb2xpZCAjZTNlNmVhO3BhZGRpbmc6MTBweCAxNHB4O3RleHQtYWxpZ246bGVmdDtiYWNrZ3JvdW5kOiNmNGY2Zjg7Zm9udC13ZWlnaHQ6NjAwIj5GZWF0dXJlPC90aD48dGggc3R5bGU9ImJvcmRlcjoxcHggc29saWQgI2UzZTZlYTtwYWRkaW5nOjEwcHggMTRweDt0ZXh0LWFsaWduOmxlZnQ7YmFja2dyb3VuZDojZjRmNmY4O2ZvbnQtd2VpZ2h0OjYwMCI+RGVja3RvcHVzIEFJPC90aD48dGggc3R5bGU9ImJvcmRlcjoxcHggc29saWQgI2UzZTZlYTtwYWRkaW5nOjEwcHggMTRweDt0ZXh0LWFsaWduOmxlZnQ7YmFja2dyb3VuZDojZjRmNmY4O2ZvbnQtd2VpZ2h0OjYwMCI+VHJhZGl0aW9uYWwgVG9vbHMgKEdvb2dsZSBTbGlkZXMsIFBvd2VyUG9pbnQsIENhbnZhKTwvdGg+PC90cj48L3RoZWFkPjx0Ym9keT48dHI+PHRkIHN0eWxlPSJib3JkZXI6MXB4IHNvbGlkICNlM2U2ZWE7cGFkZGluZzoxMHB4IDE0cHg7dGV4dC1hbGlnbjpsZWZ0O3ZlcnRpY2FsLWFsaWduOnRvcCI+QUktZ2VuZXJhdGVkIGN1c3RvbWVyIGpvdXJuZXkgcHJlc2VudGF0aW9uIGZyb20gYSBwcm9tcHQ8L3RkPjx0ZCBzdHlsZT0iYm9yZGVyOjFweCBzb2xpZCAjZTNlNmVhO3BhZGRpbmc6MTBweCAxNHB4O3RleHQtYWxpZ246bGVmdDt2ZXJ0aWNhbC1hbGlnbjp0b3AiPlllczwvdGQ+PHRkIHN0eWxlPSJib3JkZXI6MXB4IHNvbGlkICNlM2U2ZWE7cGFkZGluZzoxMHB4IDE0cHg7dGV4dC1hbGlnbjpsZWZ0O3ZlcnRpY2FsLWFsaWduOnRvcCI+Tm8gb3IgbGltaXRlZDwvdGQ+PC90cj48dHI+PHRkIHN0eWxlPSJib3JkZXI6MXB4IHNvbGlkICNlM2U2ZWE7cGFkZGluZzoxMHB4IDE0cHg7dGV4dC1hbGlnbjpsZWZ0O3ZlcnRpY2FsLWFsaWduOnRvcCI+QXV0b21hdGljIGJyYW5kIGltcG9ydCBmcm9tIGEgd2Vic2l0ZSBVUkw8L3RkPjx0ZCBzdHlsZT0iYm9yZGVyOjFweCBzb2xpZCAjZTNlNmVhO3BhZGRpbmc6MTBweCAxNHB4O3RleHQtYWxpZ246bGVmdDt2ZXJ0aWNhbC1hbGlnbjp0b3AiPlllczwvdGQ+PHRkIHN0eWxlPSJib3JkZXI6MXB4IHNvbGlkICNlM2U2ZWE7cGFkZGluZzoxMHB4IDE0cHg7dGV4dC1hbGlnbjpsZWZ0O3ZlcnRpY2FsLWFsaWduOnRvcCI+Tm8gKG1hbnVhbCBzZXR1cCk8L3RkPjwvdHI+PHRyPjx0ZCBzdHlsZT0iYm9yZGVyOjFweCBzb2xpZCAjZTNlNmVhO3BhZGRpbmc6MTBweCAxNHB4O3RleHQtYWxpZ246bGVmdDt2ZXJ0aWNhbC1hbGlnbjp0b3AiPkJlYXV0aWZ5IGV4aXN0aW5nIHByZXNlbnRhdGlvbnM8L3RkPjx0ZCBzdHlsZT0iYm9yZGVyOjFweCBzb2xpZCAjZTNlNmVhO3BhZGRpbmc6MTBweCAxNHB4O3RleHQtYWxpZ246bGVmdDt2ZXJ0aWNhbC1hbGlnbjp0b3AiPlllczwvdGQ+PHRkIHN0eWxlPSJib3JkZXI6MXB4IHNvbGlkICNlM2U2ZWE7cGFkZGluZzoxMHB4IDE0cHg7dGV4dC1hbGlnbjpsZWZ0O3ZlcnRpY2FsLWFsaWduOnRvcCI+Tm88L3RkPjwvdHI+PHRyPjx0ZCBzdHlsZT0iYm9yZGVyOjFweCBzb2xpZCAjZTNlNmVhO3BhZGRpbmc6MTBweCAxNHB4O3RleHQtYWxpZ246bGVmdDt2ZXJ0aWNhbC1hbGlnbjp0b3AiPkVkaXQgcHJlc2VudGF0aW9ucyB3aXRoIEFJIHByb21wdHM8L3RkPjx0ZCBzdHlsZT0iYm9yZGVyOjFweCBzb2xpZCAjZTNlNmVhO3BhZGRpbmc6MTBweCAxNHB4O3RleHQtYWxpZ246bGVmdDt2ZXJ0aWNhbC1hbGlnbjp0b3AiPlllczwvdGQ+PHRkIHN0eWxlPSJib3JkZXI6MXB4IHNvbGlkICNlM2U2ZWE7cGFkZGluZzoxMHB4IDE0cHg7dGV4dC1hbGlnbjpsZWZ0O3ZlcnRpY2FsLWFsaWduOnRvcCI+UGFydGlhbCBvciB1bmF2YWlsYWJsZTwvdGQ+PC90cj48dHI+PHRkIHN0eWxlPSJib3JkZXI6MXB4IHNvbGlkICNlM2U2ZWE7cGFkZGluZzoxMHB4IDE0cHg7dGV4dC1hbGlnbjpsZWZ0O3ZlcnRpY2FsLWFsaWduOnRvcCI+TG9vcCBBSSBEZWxpdmVyeSBDb2FjaCAocHJlc2VudGF0aW9uIHJlaGVhcnNhbCk8L3RkPjx0ZCBzdHlsZT0iYm9yZGVyOjFweCBzb2xpZCAjZTNlNmVhO3BhZGRpbmc6MTBweCAxNHB4O3RleHQtYWxpZ246bGVmdDt2ZXJ0aWNhbC1hbGlnbjp0b3AiPlllczwvdGQ+PHRkIHN0eWxlPSJib3JkZXI6MXB4IHNvbGlkICNlM2U2ZWE7cGFkZGluZzoxMHB4IDE0cHg7dGV4dC1hbGlnbjpsZWZ0O3ZlcnRpY2FsLWFsaWduOnRvcCI+Tm88L3RkPjwvdHI+PHRyPjx0ZCBzdHlsZT0iYm9yZGVyOjFweCBzb2xpZCAjZTNlNmVhO3BhZGRpbmc6MTBweCAxNHB4O3RleHQtYWxpZ246bGVmdDt2ZXJ0aWNhbC1hbGlnbjp0b3AiPkxpdmUtbGluayBhdXRvLXVwZGF0ZTwvdGQ+PHRkIHN0eWxlPSJib3JkZXI6MXB4IHNvbGlkICNlM2U2ZWE7cGFkZGluZzoxMHB4IDE0cHg7dGV4dC1hbGlnbjpsZWZ0O3ZlcnRpY2FsLWFsaWduOnRvcCI+WWVzPC90ZD48dGQgc3R5bGU9ImJvcmRlcjoxcHggc29saWQgI2UzZTZlYTtwYWRkaW5nOjEwcHggMTRweDt0ZXh0LWFsaWduOmxlZnQ7dmVydGljYWwtYWxpZ246dG9wIj5ObzwvdGQ+PC90cj48dHI+PHRkIHN0eWxlPSJib3JkZXI6MXB4IHNvbGlkICNlM2U2ZWE7cGFkZGluZzoxMHB4IDE0cHg7dGV4dC1hbGlnbjpsZWZ0O3ZlcnRpY2FsLWFsaWduOnRvcCI+QUkgQ2Fyb3VzZWwgTWFrZXIgZm9yIHNvY2lhbCBkaXN0cmlidXRpb248L3RkPjx0ZCBzdHlsZT0iYm9yZGVyOjFweCBzb2xpZCAjZTNlNmVhO3BhZGRpbmc6MTBweCAxNHB4O3RleHQtYWxpZ246bGVmdDt2ZXJ0aWNhbC1hbGlnbjp0b3AiPlllczwvdGQ+PHRkIHN0eWxlPSJib3JkZXI6MXB4IHNvbGlkICNlM2U2ZWE7cGFkZGluZzoxMHB4IDE0cHg7dGV4dC1hbGlnbjpsZWZ0O3ZlcnRpY2FsLWFsaWduOnRvcCI+Tm88L3RkPjwvdHI+PHRyPjx0ZCBzdHlsZT0iYm9yZGVyOjFweCBzb2xpZCAjZTNlNmVhO3BhZGRpbmc6MTBweCAxNHB4O3RleHQtYWxpZ246bGVmdDt2ZXJ0aWNhbC1hbGlnbjp0b3AiPkltcG9ydCBQREZzIGludG8gZWRpdGFibGUgcHJlc2VudGF0aW9uczwvdGQ+PHRkIHN0eWxlPSJib3JkZXI6MXB4IHNvbGlkICNlM2U2ZWE7cGFkZGluZzoxMHB4IDE0cHg7dGV4dC1hbGlnbjpsZWZ0O3ZlcnRpY2FsLWFsaWduOnRvcCI+WWVzPC90ZD48dGQgc3R5bGU9ImJvcmRlcjoxcHggc29saWQgI2UzZTZlYTtwYWRkaW5nOjEwcHggMTRweDt0ZXh0LWFsaWduOmxlZnQ7dmVydGljYWwtYWxpZ246dG9wIj5MaW1pdGVkPC90ZD48L3RyPjx0cj48dGQgc3R5bGU9ImJvcmRlcjoxcHggc29saWQgI2UzZTZlYTtwYWRkaW5nOjEwcHggMTRweDt0ZXh0LWFsaWduOmxlZnQ7dmVydGljYWwtYWxpZ246dG9wIj5NdWx0aS1mb3JtYXQgZXhwb3J0PC90ZD48dGQgc3R5bGU9ImJvcmRlcjoxcHggc29saWQgI2UzZTZlYTtwYWRkaW5nOjEwcHggMTRweDt0ZXh0LWFsaWduOmxlZnQ7dmVydGljYWwtYWxpZ246dG9wIj5ZZXM8L3RkPjx0ZCBzdHlsZT0iYm9yZGVyOjFweCBzb2xpZCAjZTNlNmVhO3BhZGRpbmc6MTBweCAxNHB4O3RleHQtYWxpZ246bGVmdDt2ZXJ0aWNhbC1hbGlnbjp0b3AiPlllczwvdGQ+PC90cj48dHI+PHRkIHN0eWxlPSJib3JkZXI6MXB4IHNvbGlkICNlM2U2ZWE7cGFkZGluZzoxMHB4IDE0cHg7dGV4dC1hbGlnbjpsZWZ0O3ZlcnRpY2FsLWFsaWduOnRvcCI+UHVycG9zZS1idWlsdCBmb3IgcHJlc2VudGF0aW9uczwvdGQ+PHRkIHN0eWxlPSJib3JkZXI6MXB4IHNvbGlkICNlM2U2ZWE7cGFkZGluZzoxMHB4IDE0cHg7dGV4dC1hbGlnbjpsZWZ0O3ZlcnRpY2FsLWFsaWduOnRvcCI+WWVzPC90ZD48dGQgc3R5bGU9ImJvcmRlcjoxcHggc29saWQgI2UzZTZlYTtwYWRkaW5nOjEwcHggMTRweDt0ZXh0LWFsaWduOmxlZnQ7dmVydGljYWwtYWxpZ246dG9wIj5WYXJpZXMgYnkgcGxhdGZvcm08L3RkPjwvdHI+PC90Ym9keT48L3RhYmxlPjwvZGl2Pg==]]
Who This Section Is For
Decktopus AI is used by SaaS teams across roles:
Customer Success Managers building QBR decks, journey maps, and expansion presentations
Product Managers presenting adoption analyses, feature engagement, and roadmap decisions
Marketing teams producing campaign reviews, funnel analyses, and lifecycle marketing decks
Sales teams creating tailored client pitch decks and renewal proposals
Founders and executives presenting board updates, investor decks, and strategic reviews
For deeper use case guidance, see Decktopus AI for Sales, Decktopus AI for Marketers, Decktopus AI for Customer Success, and Decktopus AI for Founders.
Step-by-Step: Build Your SaaS Journey Deck With Decktopus AI
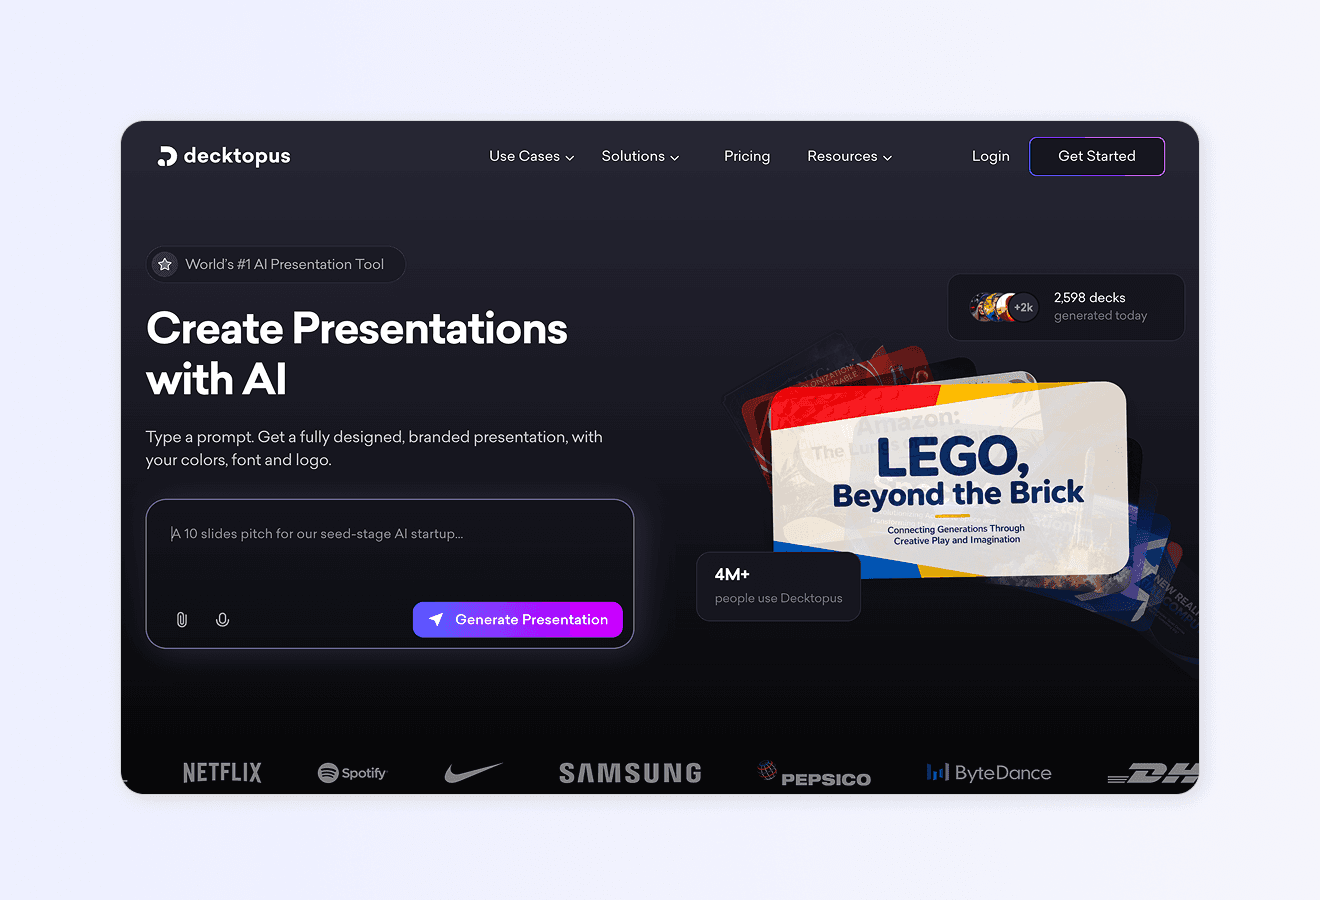
1. Describe your topic. Type something like “B2B SaaS customer journey deck for an HR tech platform focused on onboarding, engagement, and expansion.” Or upload your research doc, persona work, or previous journey map as a supporting file.
2. Choose your style. Pick a brand, reuse a saved look, or start fresh with AI. Import your company brand from your website URL so every slide is automatically on-brand.
3. Review the outline. Decktopus AI generates a slide-by-slide structure covering customer personas, journey stages, touchpoints, metrics, pain points, and recommendations. Adjust before the deck is built.
4. Refine with Edit with AI. Use prompt-based edits: “Add a segment comparison for enterprise vs. mid-market journeys,” “Add a churn risk analysis for the engagement stage,” “Make the metrics slide a visual dashboard.”
5. Rehearse with Loop AI Delivery Coach. Practice your journey walkthrough with real-time feedback before your QBR, executive review, or board update.
6. Export or share. Download as PDF, PPT, or PNG. Share via live link with auto-update so your journey map stays current for every viewer.
For broader guidance, see the best AI presentation tools, our guide on how to do a presentation, and the best pitch deck generators for founders.
Ready to turn your SaaS customer journey into a shareable deck? Get started with Decktopus AI and generate your first on-brand journey map in minutes.
Frequently Asked Questions
What is a SaaS customer journey?
A SaaS customer journey is the end-to-end experience a customer has with a SaaS product, from first awareness through evaluation, onboarding, ongoing usage, renewal, expansion, and advocacy. It’s different from traditional customer journeys because it continues indefinitely rather than ending at purchase.
What are the 6 stages of the SaaS customer journey?
Awareness (discovering the product), Consideration (evaluating options), Onboarding (setting up and starting use), Engagement (regular product usage), Renewal or Expansion (deciding to continue, upgrade, or churn), and Advocacy (becoming a promoter). Each stage requires different tactics, teams, and metrics.
Why is SaaS customer journey mapping important?
It aligns product, marketing, sales, and customer success teams around the same customer experience. Companies that map and optimize their SaaS journey typically see 20% to 40% improvements in retention, expansion revenue, and customer lifetime value. Given that a 5% retention improvement can lift profits 25% to 95%, journey mapping is one of the highest-ROI activities in SaaS.
What is customer experience (CX) in SaaS?
CX in SaaS refers to the total perception a customer has of every interaction with the SaaS product across the full journey. It covers marketing touchpoints, product usability, customer support, onboarding, renewal experiences, and everything in between. Strong CX drives retention. Weak CX drives churn.
What are the key stages of SaaS growth?
Product development, launch, customer acquisition, retention and engagement, and expansion through upsell and advocacy. Each stage has its own metrics, teams, and playbooks, but they share the same underlying framework: turn customers into loyal, expanding, referring accounts.
What is CLV (Customer Lifetime Value) in SaaS?
CLV measures the total revenue a SaaS company expects to earn from a single customer over the full duration of their relationship. It’s calculated by multiplying average revenue per account by average retention time. High CLV is the north star metric for most SaaS businesses because it justifies acquisition spend.
What is SaaS customer engagement?
Customer engagement is how frequently, deeply, and satisfyingly customers interact with your SaaS product. It’s measured through metrics like DAU/MAU ratios, feature adoption, session duration, and NPS. High engagement correlates strongly with retention, expansion, and advocacy.
How do I measure success at each stage of the journey?
Each stage has its own KPIs. Awareness: website traffic and lead volume. Consideration: trial signup and demo conversion. Onboarding: time to first value and activation rate. Engagement: DAU/MAU and feature adoption. Renewal: gross and net retention. Advocacy: referral revenue and review volume. See the “Key Metrics for Each Journey Stage” table above.
What tools help optimize the SaaS customer journey?
Intercom for engagement and support, Heap for behavioral analytics, Pendo for product onboarding, HubSpot for CRM, and Mixpanel for product analytics. For visualizing and presenting the journey to stakeholders, Decktopus AI generates full journey map decks from a short description.
How often should I update my SaaS customer journey map?
Review quarterly and update whenever significant business changes happen (new persona, major product launch, revised pricing, market shift). Journey maps that don’t evolve stop reflecting reality and lose value fast.
What’s the difference between a customer journey map and a customer lifecycle?
They overlap but focus differently. A customer lifecycle is the broad phases (acquire, activate, retain, expand). A customer journey map is more granular, mapping specific touchpoints, emotions, and experiences within each phase. Most SaaS teams use both as complementary frameworks. See our customer success lifecycle guide.
How does personalization affect the SaaS journey?
Personalization dramatically improves engagement and retention. Segmented, tailored experiences (based on persona, behavior, or account stage) consistently outperform one-size-fits-all approaches. Personalization can happen at every stage: personalized onboarding, targeted feature nudges, tailored renewal outreach, and customized expansion offers.
How can I reduce churn using the customer journey?
Identify the specific touchpoints where customers drop off and address them systematically. Common churn triggers include confusing onboarding, feature gaps, poor support experiences, low engagement, and price sensitivity at renewal. A well-mapped journey surfaces each of these so you can build interventions.
What role does AI play in optimizing the SaaS customer journey?
AI supports every stage: predictive churn analytics, personalized onboarding, automated support, feature recommendation, and journey visualization. Tools like Decktopus AI specifically help with communicating and presenting journey insights to stakeholders across the organization. See our guide on AI-powered SaaS.
What is the best way to present a SaaS customer journey to executives?
Use a clean, on-brand presentation deck that shows the full journey visually, backed by real data at each stage. Focus on the moments that matter most (activation, expansion, churn risk) and tie each stage to business outcomes (retention, revenue, CLV). Decktopus AI is built for exactly this kind of stakeholder communication.
Conclusion
The SaaS customer journey is one of the highest-leverage frameworks in modern SaaS. Get it right and you build a compounding business where every stage feeds the next: strong marketing produces qualified prospects, strong sales converts them, strong onboarding activates them, strong engagement retains them, strong renewal expands them, and strong advocacy accelerates the whole cycle.
The 6-stage framework in this guide (Awareness, Consideration, Onboarding, Engagement, Renewal/Expansion, Advocacy) gives you a structure every team can align around. The metrics table shows what to measure. The case studies show what’s possible when top SaaS companies get the journey right. And the common mistakes section shows where most teams stumble.
Turning your journey analysis into a clear, shareable presentation is the last critical step. Decktopus AI is built specifically for this: AI-generated journey decks in minutes, automatic brand import, Beautify for refreshing older decks, Edit with AI for iteration, Loop AI Delivery Coach for rehearsal, and live-link sharing for team distribution. It’s the fastest way to move from journey insights on a whiteboard to a professional deck your executives, board, and customer success team can act on.
For more resources, see our guides on ai-powered SaaS, the customer success lifecycle, and the best AI presentation tools.
Related posts

How to Improve Communication Skills at Work (2026 Practical Guide)
The 5 workplace communication skills that matter most, the CLEAR framework, and the AI practice method that turns weak communicators into strong ones.
Business & Strategy

Job Interview Sample Questions: How to Practice Your Answers (2026)
The 20 most common interview questions, the STAR framework for answers, and the AI practice method that turns rehearsed responses into confident ones.
Business & Strategy

How to Negotiate a Raise: The Script, Practice Method & Tips That Actually Work
A step-by-step script for negotiating a raise, common mistakes to avoid, and the AI practice method that turns a nervous ask into a confident one.
Business & Strategy