Templates & How-to
Top 10 Bar Graph Makers 2026: Create a Bar Chart for Free
Creating bar graphs is easier than ever! With this bar graph makers, create and customize your charts in few seconds!

Why Use a Bar Graph in 2026?
Bar charts are a timeless and powerful tool for comparing categories of data. Whether you’re visualizing survey results, sales figures, or academic stats, a well-designed bar graph can make your message instantly clear.
In 2026, you don’t need Excel wizardry or graphic design skills to build one. Thanks to smart tools and the best AI presentation maker, anyone can create beautiful bar charts in just a few clicks.
In this post, we’ll walk you through the 10 best free bar graph makers you can use right now to level up your presentations, dashboards, or school projects.

What Makes a Great Bar Graph Maker?
The best bar chart tools share these key features:
✅ Easy to use — No design or coding required
✅ Customizable — Edit colors, labels, and layout
✅ Fast — Import your data or type it in
✅ Free — At least a solid free plan available
Let’s explore the top 10 tools that meet the mark 👇
📊 What Is a Bar Graph?
A bar graph (or bar chart) is a visual representation of data that uses rectangular bars to compare different categories. The height or length of each bar reflects the value it represents, making patterns and differences easy to spot at a glance.
Bar graphs are popular because they’re:
Simple to understand
Great for comparing values side by side
Effective in presentations, reports, and dashboards
🛠️ How to Make a Bar Graph (Step-by-Step)
Creating a bar graph is easier than ever with today’s free online tools. You don’t need to be a designer or data expert.
Here’s how it works:
Enter your data
Make sure your data includes categories (e.g. months, products, age groups) and numerical values.
Map it out
X-axis = categories
Y-axis = values
Customize your chart
Choose colors, labels, titles, and layout to fit your style or brand.
Export and share
Download your chart as a PNG, PDF, or use it directly in a presentation.
🧠 Bonus: Tools like Decktopus offer AI-powered slide builders with built-in bar graph generators, along with pie charts, line graphs, and more!
🏆 Top 10 Bar Graph Creators (Updated for 2026)
Here’s a snapshot of the best tools available to create professional bar charts quickly
[[EMBED:PGRpdiBzdHlsZT0ib3ZlcmZsb3cteDphdXRvO21hcmdpbjoyMHB4IDAiPjx0YWJsZSBzdHlsZT0id2lkdGg6MTAwJTtib3JkZXItY29sbGFwc2U6Y29sbGFwc2U7Zm9udC1zaXplOjE1cHg7bWFyZ2luOjhweCAwIj48dHI+PHRoIHN0eWxlPSJib3JkZXI6MXB4IHNvbGlkICNlM2U2ZWE7cGFkZGluZzoxMHB4IDE0cHg7dGV4dC1hbGlnbjpsZWZ0O2JhY2tncm91bmQ6I2Y0ZjZmODtmb250LXdlaWdodDo2MDAiPlRvb2wgTmFtZTwvdGg+PHRoIHN0eWxlPSJib3JkZXI6MXB4IHNvbGlkICNlM2U2ZWE7cGFkZGluZzoxMHB4IDE0cHg7dGV4dC1hbGlnbjpsZWZ0O2JhY2tncm91bmQ6I2Y0ZjZmODtmb250LXdlaWdodDo2MDAiPkRlc2NyaXB0aW9uPC90aD48L3RyPjx0cj48dGQgc3R5bGU9ImJvcmRlcjoxcHggc29saWQgI2UzZTZlYTtwYWRkaW5nOjEwcHggMTRweDt0ZXh0LWFsaWduOmxlZnQ7dmVydGljYWwtYWxpZ246dG9wIj5EZWNrdG9wdXM8L3RkPjx0ZCBzdHlsZT0iYm9yZGVyOjFweCBzb2xpZCAjZTNlNmVhO3BhZGRpbmc6MTBweCAxNHB4O3RleHQtYWxpZ246bGVmdDt2ZXJ0aWNhbC1hbGlnbjp0b3AiPkNvbnRlbnQgY3JlYXRpb24gYW5kIHByZXNlbnRhdGlvbiB0b29sPC90ZD48L3RyPjx0cj48dGQgc3R5bGU9ImJvcmRlcjoxcHggc29saWQgI2UzZTZlYTtwYWRkaW5nOjEwcHggMTRweDt0ZXh0LWFsaWduOmxlZnQ7dmVydGljYWwtYWxpZ246dG9wIj5SYXBpZFRhYmxlczwvdGQ+PHRkIHN0eWxlPSJib3JkZXI6MXB4IHNvbGlkICNlM2U2ZWE7cGFkZGluZzoxMHB4IDE0cHg7dGV4dC1hbGlnbjpsZWZ0O3ZlcnRpY2FsLWFsaWduOnRvcCI+T25saW5lIHRhYmxlIGFuZCBjaGFydCBnZW5lcmF0b3I8L3RkPjwvdHI+PHRyPjx0ZCBzdHlsZT0iYm9yZGVyOjFweCBzb2xpZCAjZTNlNmVhO3BhZGRpbmc6MTBweCAxNHB4O3RleHQtYWxpZ246bGVmdDt2ZXJ0aWNhbC1hbGlnbjp0b3AiPlJhd0dyYXBoczwvdGQ+PHRkIHN0eWxlPSJib3JkZXI6MXB4IHNvbGlkICNlM2U2ZWE7cGFkZGluZzoxMHB4IDE0cHg7dGV4dC1hbGlnbjpsZWZ0O3ZlcnRpY2FsLWFsaWduOnRvcCI+T3Blbi1zb3VyY2UgZGF0YSB2aXN1YWxpemF0aW9uIGZyYW1ld29yazwvdGQ+PC90cj48dHI+PHRkIHN0eWxlPSJib3JkZXI6MXB4IHNvbGlkICNlM2U2ZWE7cGFkZGluZzoxMHB4IDE0cHg7dGV4dC1hbGlnbjpsZWZ0O3ZlcnRpY2FsLWFsaWduOnRvcCI+VmlzbWU8L3RkPjx0ZCBzdHlsZT0iYm9yZGVyOjFweCBzb2xpZCAjZTNlNmVhO3BhZGRpbmc6MTBweCAxNHB4O3RleHQtYWxpZ246bGVmdDt2ZXJ0aWNhbC1hbGlnbjp0b3AiPlZpc3VhbCBjb250ZW50IGNyZWF0aW9uIHBsYXRmb3JtPC90ZD48L3RyPjx0cj48dGQgc3R5bGU9ImJvcmRlcjoxcHggc29saWQgI2UzZTZlYTtwYWRkaW5nOjEwcHggMTRweDt0ZXh0LWFsaWduOmxlZnQ7dmVydGljYWwtYWxpZ246dG9wIj5DYW52YTwvdGQ+PHRkIHN0eWxlPSJib3JkZXI6MXB4IHNvbGlkICNlM2U2ZWE7cGFkZGluZzoxMHB4IDE0cHg7dGV4dC1hbGlnbjpsZWZ0O3ZlcnRpY2FsLWFsaWduOnRvcCI+R3JhcGhpYyBkZXNpZ24gYW5kIHByZXNlbnRhdGlvbiB0b29sPC90ZD48L3RyPjx0cj48dGQgc3R5bGU9ImJvcmRlcjoxcHggc29saWQgI2UzZTZlYTtwYWRkaW5nOjEwcHggMTRweDt0ZXh0LWFsaWduOmxlZnQ7dmVydGljYWwtYWxpZ246dG9wIj5MaW5lIEdyYXBoIE1ha2VyPC90ZD48dGQgc3R5bGU9ImJvcmRlcjoxcHggc29saWQgI2UzZTZlYTtwYWRkaW5nOjEwcHggMTRweDt0ZXh0LWFsaWduOmxlZnQ7dmVydGljYWwtYWxpZ246dG9wIj5PbmxpbmUgdG9vbCBmb3IgY3JlYXRpbmcgbGluZSBncmFwaHM8L3RkPjwvdHI+PHRyPjx0ZCBzdHlsZT0iYm9yZGVyOjFweCBzb2xpZCAjZTNlNmVhO3BhZGRpbmc6MTBweCAxNHB4O3RleHQtYWxpZ246bGVmdDt2ZXJ0aWNhbC1hbGlnbjp0b3AiPlZpenpsbzwvdGQ+PHRkIHN0eWxlPSJib3JkZXI6MXB4IHNvbGlkICNlM2U2ZWE7cGFkZGluZzoxMHB4IDE0cHg7dGV4dC1hbGlnbjpsZWZ0O3ZlcnRpY2FsLWFsaWduOnRvcCI+Q2hhcnQgYW5kIGRpYWdyYW0gY3JlYXRpb24gdG9vbDwvdGQ+PC90cj48dHI+PHRkIHN0eWxlPSJib3JkZXI6MXB4IHNvbGlkICNlM2U2ZWE7cGFkZGluZzoxMHB4IDE0cHg7dGV4dC1hbGlnbjpsZWZ0O3ZlcnRpY2FsLWFsaWduOnRvcCI+TWljcm9zb2Z0IEV4Y2VsPC90ZD48dGQgc3R5bGU9ImJvcmRlcjoxcHggc29saWQgI2UzZTZlYTtwYWRkaW5nOjEwcHggMTRweDt0ZXh0LWFsaWduOmxlZnQ7dmVydGljYWwtYWxpZ246dG9wIj5TcHJlYWRzaGVldCBzb2Z0d2FyZSB3aXRoIGRhdGEgdmlzdWFsaXphdGlvbiBmZWF0dXJlczwvdGQ+PC90cj48dHI+PHRkIHN0eWxlPSJib3JkZXI6MXB4IHNvbGlkICNlM2U2ZWE7cGFkZGluZzoxMHB4IDE0cHg7dGV4dC1hbGlnbjpsZWZ0O3ZlcnRpY2FsLWFsaWduOnRvcCI+QWRvYmUgRXhwcmVzcyBHcmFwaCBNYWtlcjwvdGQ+PHRkIHN0eWxlPSJib3JkZXI6MXB4IHNvbGlkICNlM2U2ZWE7cGFkZGluZzoxMHB4IDE0cHg7dGV4dC1hbGlnbjpsZWZ0O3ZlcnRpY2FsLWFsaWduOnRvcCI+R3JhcGggY3JlYXRpb24gdG9vbCBieSBBZG9iZTwvdGQ+PC90cj48dHI+PHRkIHN0eWxlPSJib3JkZXI6MXB4IHNvbGlkICNlM2U2ZWE7cGFkZGluZzoxMHB4IDE0cHg7dGV4dC1hbGlnbjpsZWZ0O3ZlcnRpY2FsLWFsaWduOnRvcCI+VGFibGVhdTwvdGQ+PHRkIHN0eWxlPSJib3JkZXI6MXB4IHNvbGlkICNlM2U2ZWE7cGFkZGluZzoxMHB4IDE0cHg7dGV4dC1hbGlnbjpsZWZ0O3ZlcnRpY2FsLWFsaWduOnRvcCI+QnVzaW5lc3MgaW50ZWxsaWdlbmNlIGFuZCBkYXRhIHZpc3VhbGl6YXRpb24gcGxhdGZvcm08L3RkPjwvdHI+PC90YWJsZT48L2Rpdj4=]]
1. Decktopus
Decktopus is an AI presentation tool that builds full decks from a short description. When your presentation needs a bar graph, Decktopus generates it automatically as part of the deck, so you don’t have to switch tools or design charts manually.

🛠️ Key Features Include:
AI Presentation Generation: Full deck built from your topic in minutes
Auto-generated charts and visuals (Bar Chart Maker, Pie Chart Maker, Line Chart Maker, Donut Chart Maker and more) inside your presentation
Brand Import: Paste your website URL to auto-apply your brand
Brand Compliance: Auto-checks every slide for brand consistency
Prompt-based Editing: Refine any slide by typing what you want changed
Slide Library: Save and reuse high-performing slides
Version History: Restore any past version in one click
Export as PDF or PPT, share via link, or present directly
🎯 How to Create a Bar Graph on Decktopus
Creating a bar graph in Decktopus happens automatically as part of building your presentation:
Describe your topic. Type what your deck is about, including the data points you want to visualize. Or upload supporting files like spreadsheets or research.
Choose your style. Paste your website URL to apply your brand automatically, or let AI generate a style.
Review the outline. Adjust the slide structure before the full deck is generated. Bar graphs and other visuals are included where they make sense.
Refine in the editor. Use the prompt bar to adjust any chart with instructions like “make the bar chart show quarterly data” or “switch to a horizontal bar layout.” Brand Compliance keeps everything on-brand.
Export or share. Download as PDF or PPT, share via link, or present directly.

[[EMBED:PGRpdiBzdHlsZT0iYmFja2dyb3VuZDpsaW5lYXItZ3JhZGllbnQoMTM1ZGVnLCM0ZjYxZmYsIzdDM0FFRCk7Ym9yZGVyLXJhZGl1czoxNnB4O3BhZGRpbmc6MzJweCAyOHB4O3RleHQtYWxpZ246Y2VudGVyO21hcmdpbjoyOHB4IDA7Y29sb3I6I2ZmZiI+PGRpdiBzdHlsZT0iZm9udC1zaXplOjIycHg7Zm9udC13ZWlnaHQ6NzAwO2xpbmUtaGVpZ2h0OjEuMzttYXJnaW4tYm90dG9tOjhweCI+Q3JlYXRlIHlvdXIgbmV4dCBwcmVzZW50YXRpb24gd2l0aCBBSTwvZGl2PjxkaXYgc3R5bGU9ImZvbnQtc2l6ZToxNXB4O2xpbmUtaGVpZ2h0OjEuNTtvcGFjaXR5Oi45MjttYXJnaW46MCBhdXRvIDIwcHg7bWF4LXdpZHRoOjUyMHB4Ij5UdXJuIGFueSB0b3BpYyBpbnRvIGEgcG9saXNoZWQsIG9uLWJyYW5kIGRlY2sgaW4gbWludXRlcyB3aXRoIERlY2t0b3B1cy48L2Rpdj48YSBocmVmPSJodHRwczovL2FwcC5kZWNrdG9wdXMuY29tL3JlZ2lzdGVyIiB0YXJnZXQ9Il9ibGFuayIgcmVsPSJub29wZW5lciIgc3R5bGU9ImRpc3BsYXk6aW5saW5lLWJsb2NrO2JhY2tncm91bmQ6I2ZmZjtjb2xvcjojNGY2MWZmO3BhZGRpbmc6MTRweCAzMnB4O2JvcmRlci1yYWRpdXM6MTBweDtmb250LXdlaWdodDo2MDA7Zm9udC1zaXplOjE1cHg7dGV4dC1kZWNvcmF0aW9uOm5vbmUiPkdldCBTdGFydGVkIEZyZWU8L2E+PC9kaXY+]]
✅ Pros of Using Decktopus
Try it instantly: No installation needed—just sign up and start creating.
Web-based access: Work from anywhere, anytime using your browser.
AI-powered slide creation: Describe your topic and Decktopus builds the full deck (including charts and visuals) automatically.
Download your work: Export your slides or share them online with one click.
Advanced features available: Unlock premium tools and templates with a paid plan. View pricing.
Team collaboration: Work together in real-time—ideal for marketing teams, educators, and remote workplaces.
Brand import: Paste your website URL once and every chart, slide, and graph stays on-brand.

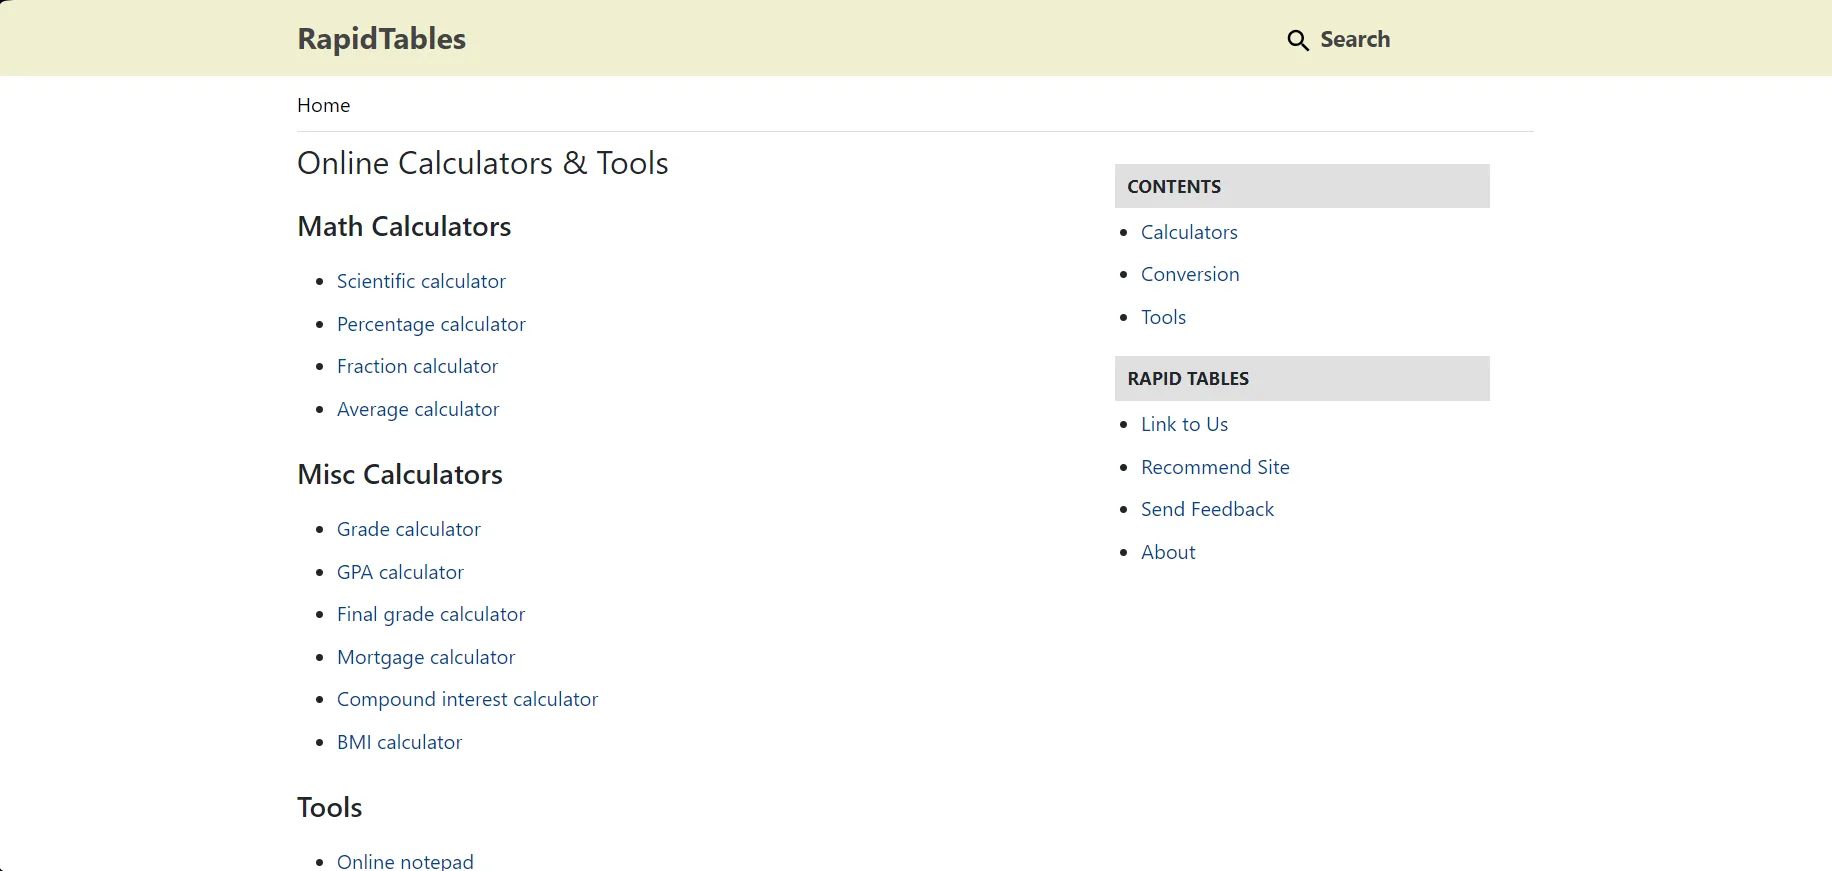
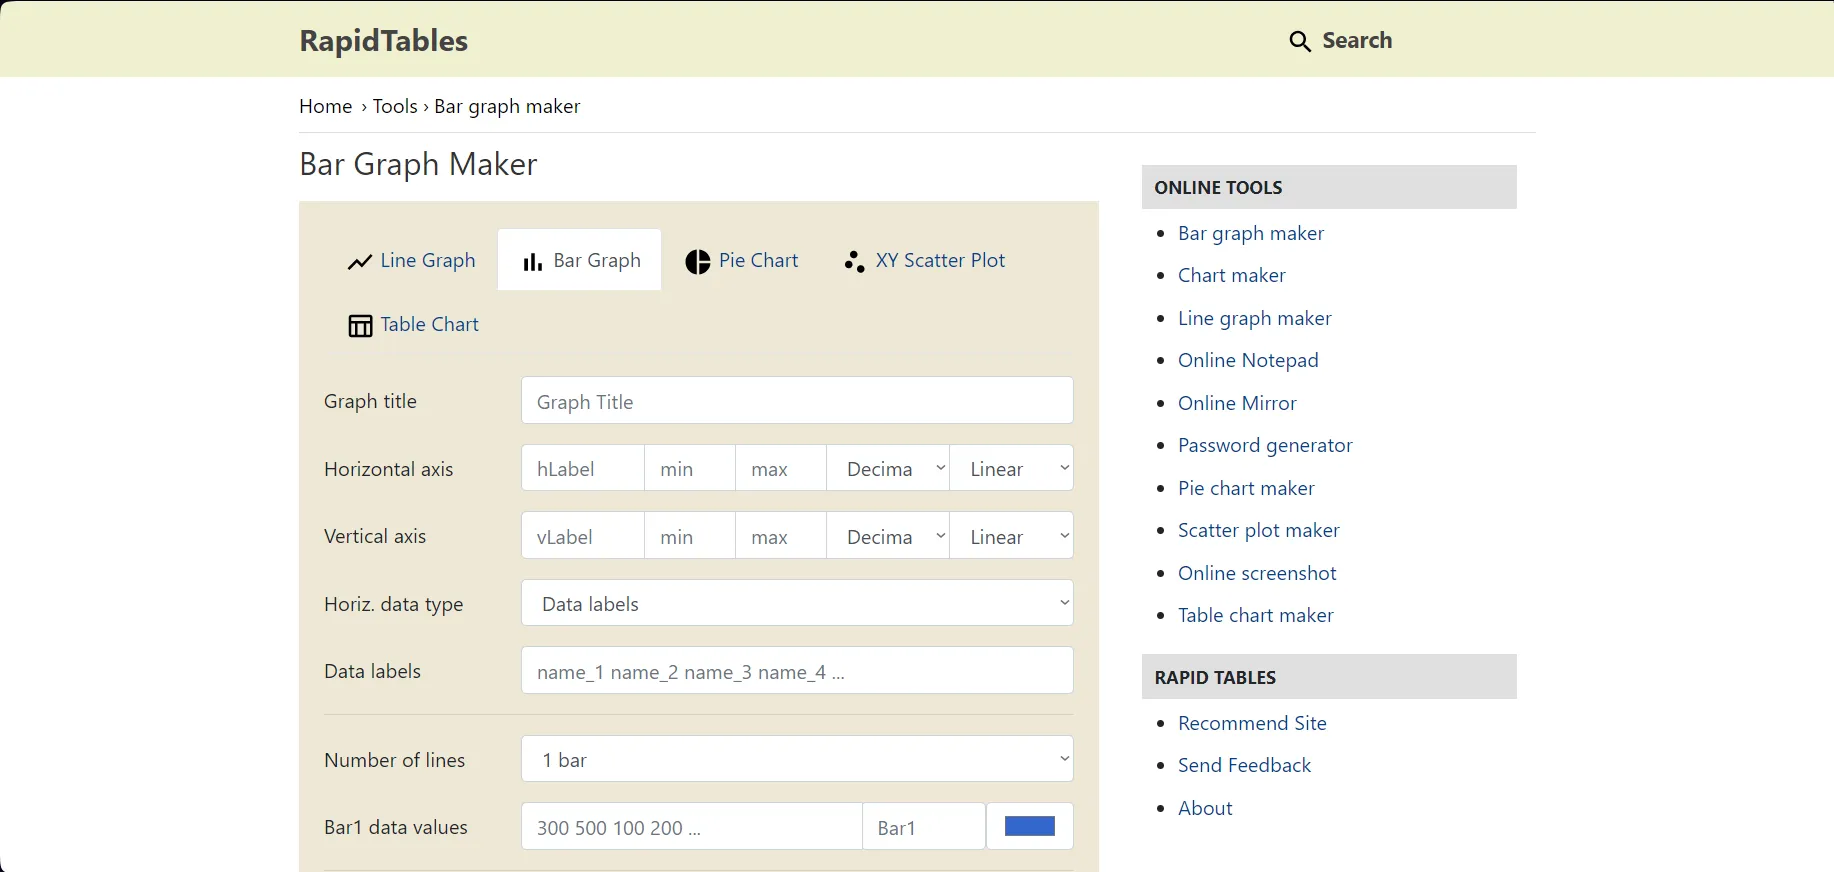
2. RapidTables
RapidTables is a simple, browser-based tool offering a variety of chart and table generators. Its bar graph maker is beginner-friendly and allows fast chart creation without the need to sign up.
🔧 Key Features:
Create bar graphs, pie charts, line graphs, scatter plots, and tables—all from the same page.
Offers moderate customization options including bar color, labels, and axis control.
Clean, straightforward interface suited for quick visualizations.
✅ Pros of Using RapidTables:
Completely free to use with no registration required.
Offers multiple chart types in one place.
Lightweight and loads quickly, even on older devices.
❌ Cons to Consider:
Manual data entry only — no file uploads or imports.
Some chart configuration steps may be confusing for new users.
No real-time collaboration or sharing features.
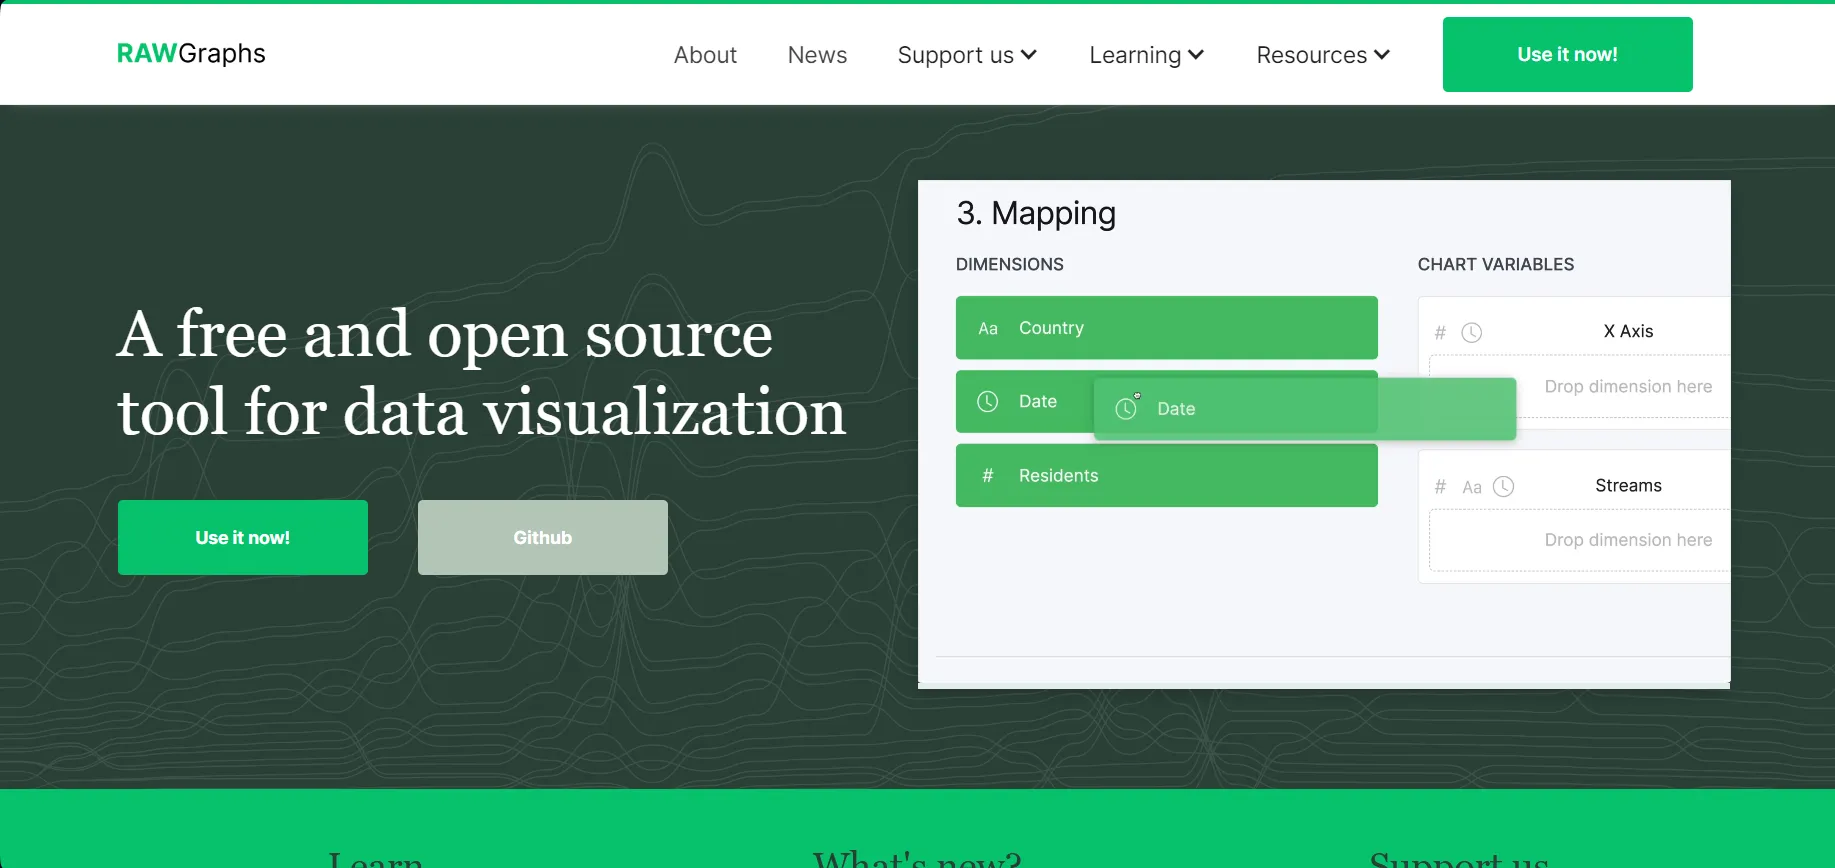
3. RawGraphs
RawGraphs is a powerful open-source data visualization tool built for designers and data analysts. It supports a wide range of data formats and allows users to create professional bar charts and other visualizations with precision.
If you’re looking for a flexible and free bar graph maker with export options and advanced visual control, RawGraphs is a great choice.
🔧 Key Features:
Supports data uploads from Excel, CSV, TSV, Google Sheets, and text editors.
Automatically detects and categorizes numerical and categorical data.
Offers dozens of visualization types, including horizontal and vertical bar charts.
✅ Pros of Using RawGraphs:
100% free and open source — no account required.
Supports bulk data from spreadsheets and text files.
Exports charts in SVG, PNG, JPG, and proprietary RawGraphs formats.
Great for visualizing complex datasets and customizing layouts.
❌ Cons to Consider:
The interface may have a slight learning curve for beginners.
Limited in-built templates — requires manual styling.
Does not support real-time team collaboration.
🧠 Pro Tip: For fast exports and a wide range of visual styles, RawGraphs is perfect for designers and researchers needing full control without the price tag.
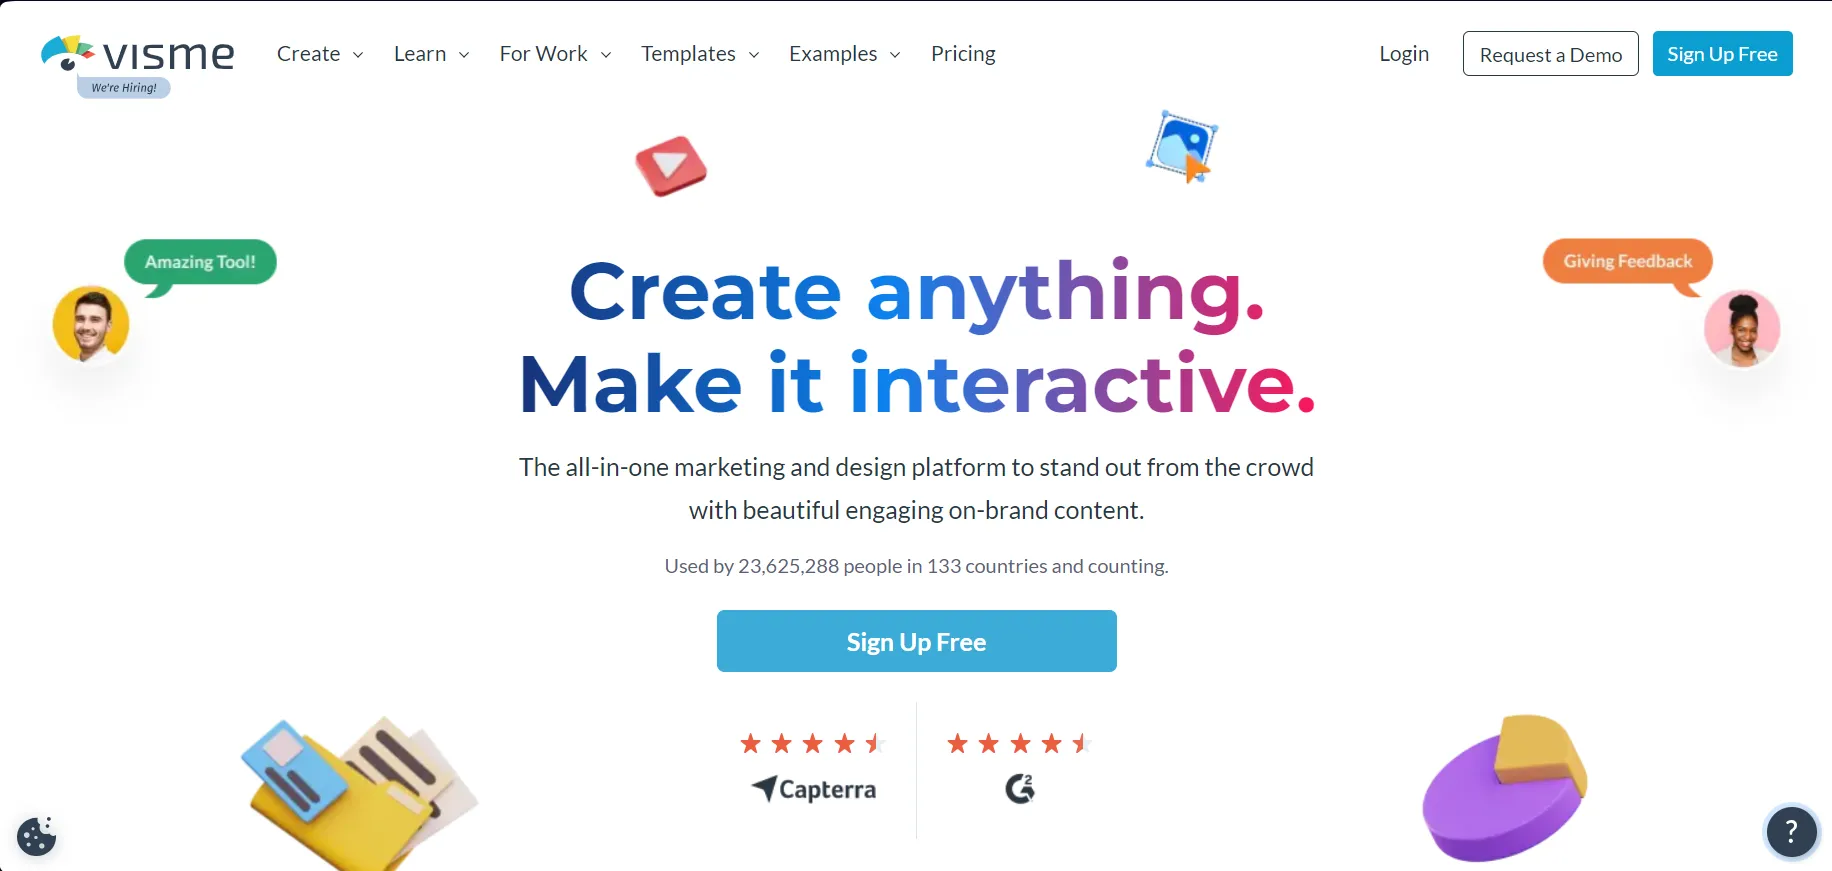
4. Visme
Visme is a versatile visual content creation platform that goes beyond bar charts. With Visme, you can create beautiful infographics, presentations, interactive data visualizations, and more — all in one place.
If you’re searching for a visually polished and interactive bar graph maker with template-rich design, Visme might be your perfect match.
🔧 Key Features:
Includes a library of pre-designed bar chart templates.
Supports interactive and animated graph elements.
Drag-and-drop editor with easy-to-use customization tools.
Can export visuals for web, print, or presentations.
✅ Pros of Using Visme:
A free plan is available with basic tools.
Collaboration features allow team members to co-edit visual projects.
Offers various types of visual content: charts, infographics, reports, and videos.
Easy for non-designers with its intuitive user interface.
❌ Cons to Consider:
Free version is limited in functionality and customization.
Premium plans start at $12.25/month, which may not suit all budgets.
Some advanced features require a paid subscription to unlock.
🎯 Best For: Marketers, educators, and business professionals looking for sleek, engaging charts with interactive elements.
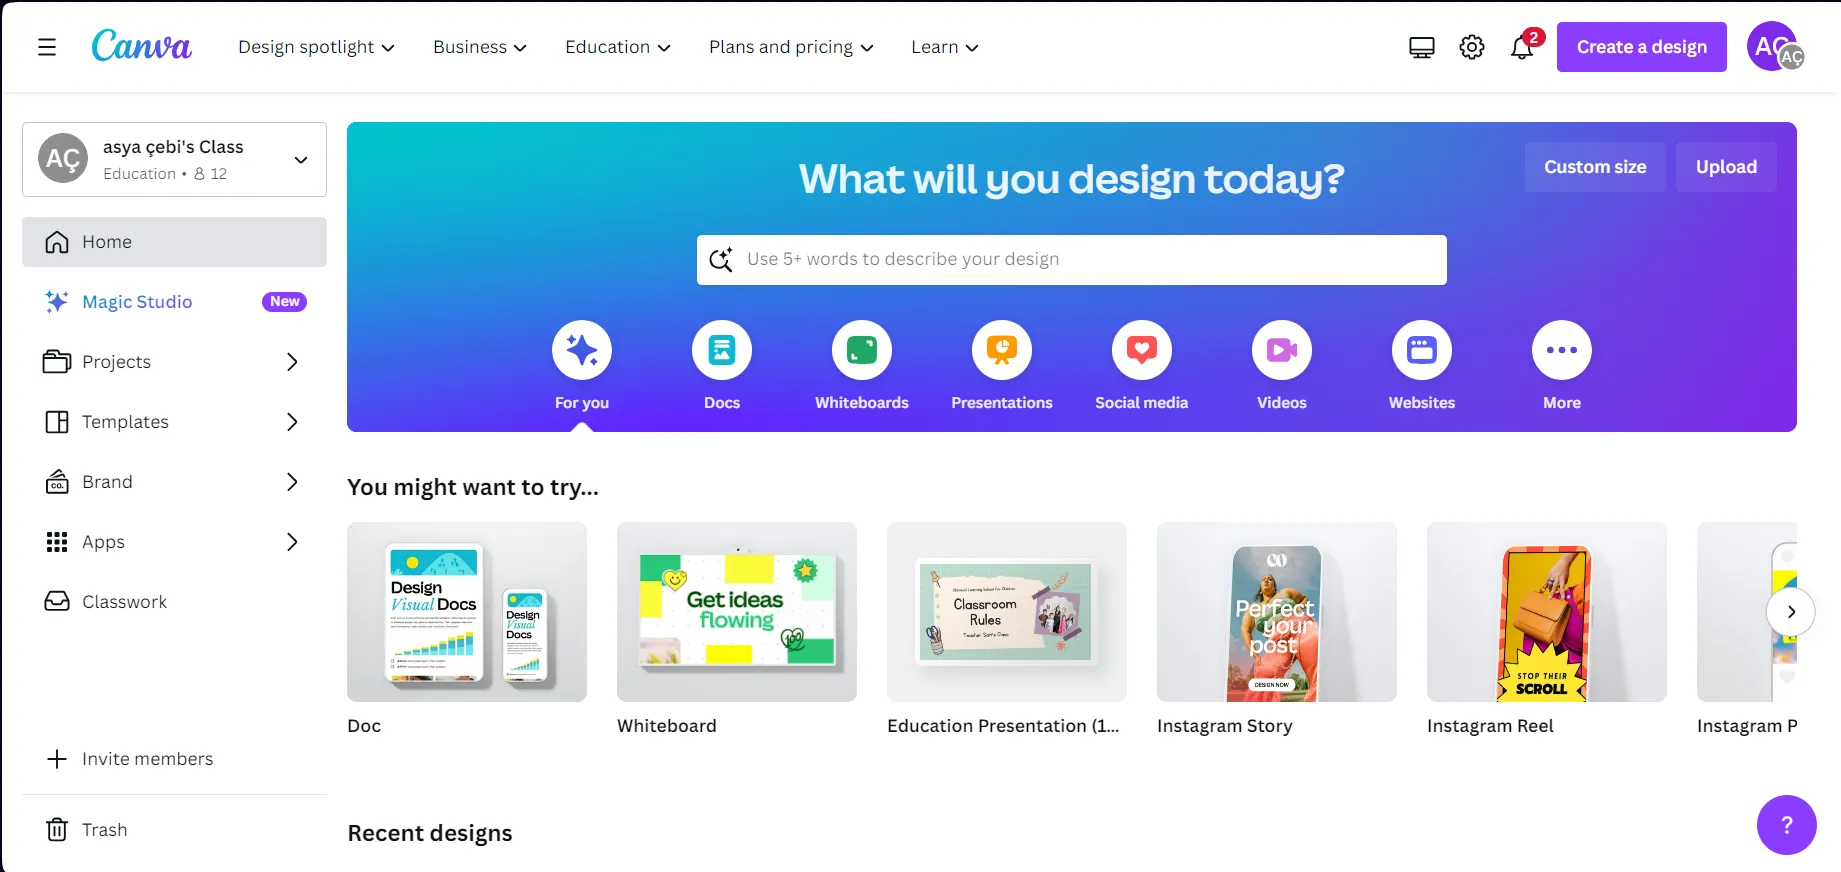
5. Canva
Canva is one of the most well-known design platforms, used by millions for creating everything from social media graphics to full-blown presentations. Among its many tools, Canva also offers a user-friendly bar graph maker—perfect for beginners and professionals alike.
Canva’s intuitive drag-and-drop editor and vast template library make it easy to build visually appealing graphs without any design background.
🔧 Key Features:
Huge library of bar graph templates, charts, and infographics.
Offers drag-and-drop customization for colors, fonts, and layouts.
Supports export in multiple formats: PNG, JPG, PDF, and more.
Built-in access to icons, illustrations, and stock images.
✅ Pros of Using Canva:
Free plan available with essential tools and templates.
Seamless collaboration — invite team members to edit in real time.
Versatile: create presentations, social media posts, resumes, videos, and more.
Web-based and accessible from desktop or mobile devices.
❌ Cons to Consider:
The free version limits access to premium templates and assets.
Manual data entry — you can’t paste spreadsheet data directly into chart templates.
Pricing can be higher than some alternatives, especially for Pro features.
🎯 Best For: Designers, content creators, teachers, and marketers looking for custom-styled bar charts integrated into broader visual projects.
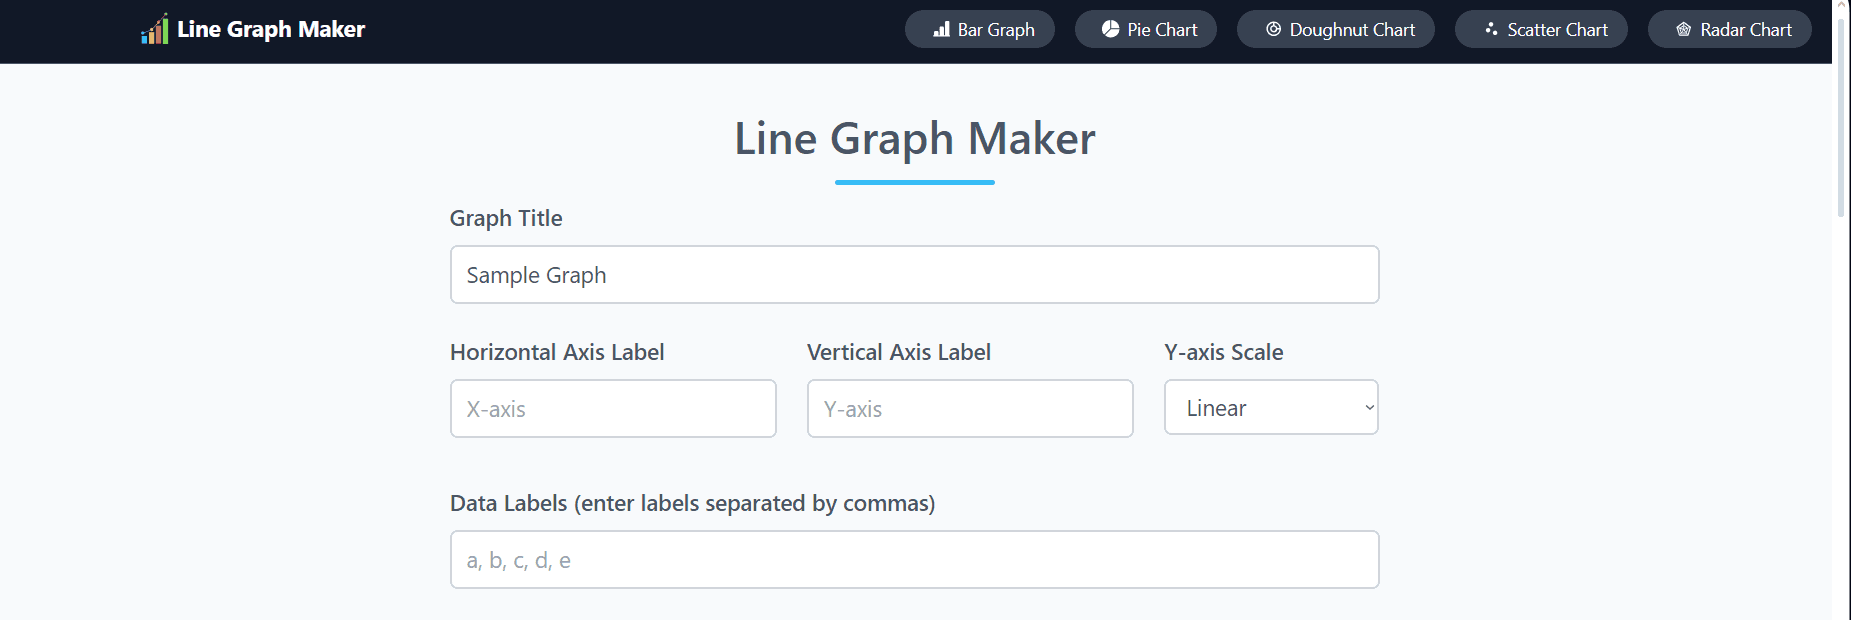
6. Line Graph Maker
Line Graph Maker is a simple and effective online tool designed for users who need quick and basic data visualizations. While it’s primarily known for line charts, it also supports bar graphs, scatter plots, radar charts, and doughnut charts.
It’s an ideal option if you want a no-login, no-frills graph generator.
🔧 Key Features:
Customize titles, labels, values, and legend positions.
Supports bar graph creation alongside line and pie charts.
Web-based and does not require registration.
✅ Pros:
100% free to use — no paywalls or accounts needed.
You can download your bar chart as PNG or JPG files.
Extremely user-friendly — perfect for students or one-time use.
❌ Cons:
Data entry is manual only (no spreadsheet integration).
Lacks design customization or advanced formatting options.
No real-time collaboration tools or team features.
🎯 Best For: Students, educators, or casual users who need a quick and easy chart without signing up.
7. Vizzlo
Vizzlo is a powerful graph and chart creation platform built for professionals. It’s particularly useful for business presentations and data storytelling, thanks to its polished templates and seamless integrations.
Whether you’re working on Google Slides, PowerPoint, or Excel, Vizzlo makes it easy to turn raw data into impactful visuals.
🔧 Key Features:
Supports CSV and Excel data imports.
Includes 100+ templates for bar charts, timelines, area graphs, and more.
Offers drag-and-drop customization for fonts, labels, layout, and colors.
Step-by-step tutorials available for beginners.

✅ Pros:
Completely web-based and easy to use.
Free plan available with generous chart types.
Compatible with PowerPoint, Google Slides, and more.
Team collaboration features for shared projects.
❌ Cons:
Template selection, while polished, is limited in the free plan.
Some advanced features are locked behind the premium subscription.
May be time-consuming for large datasets or heavily customized charts.
🎯 Best For: Professionals, consultants, and teams who frequently create business reports, sales decks, or strategic visuals.
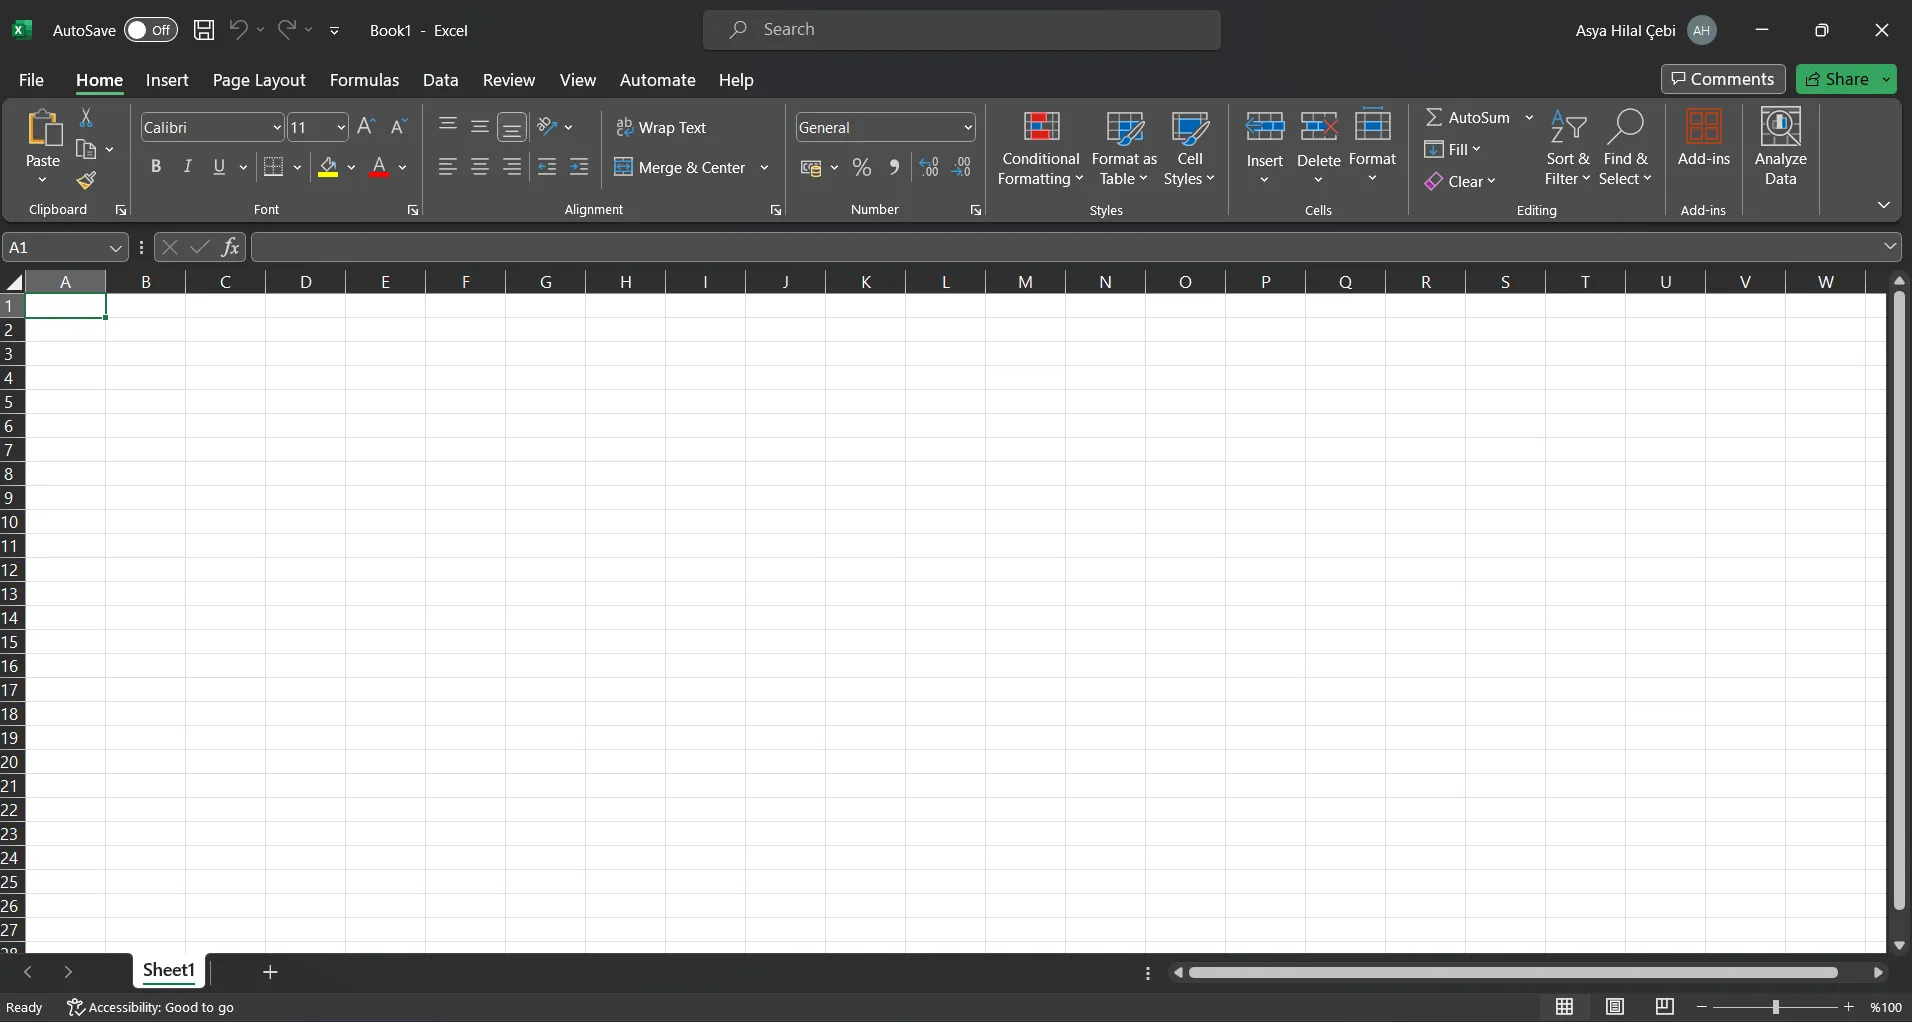
8. Microsoft Excel
Microsoft Excel is a go-to tool for creating bar graphs—especially if your data is already in spreadsheet format. It’s widely used in business, education, and research settings due to its powerful data handling and charting capabilities.
🔧 Key Features:
Instantly turn your data into bar graphs, column charts, and more.
Offers deep customization for labels, colors, axes, and legends.
Integrates well with other Microsoft Office tools.
Data formulas and pivot tables help create dynamic graphs.
✅ Pros:
Most data is already in Excel — making visualization seamless.
Free to use if you already have Excel installed.
Compatible with Microsoft Teams and OneDrive for easy sharing.
Offers strong data analysis tools built into graphing features.
❌ Cons:
Interface may be complex for beginners unfamiliar with chart tools.
Real-time collaboration only available through Microsoft 365.
Not purpose-built solely for visuals like dedicated bar graph makers.
🎯 Best For: Business professionals, analysts, and students who already use Excel for data tracking and need integrated visualizations.
9. Adobe Express Graph Maker
Adobe Express is a beginner-friendly design tool from Adobe that includes a quick and intuitive graph maker. It’s perfect for users who want beautiful, clean charts without needing to learn complex software.
🔧 Key Features:
Create bar graphs, pie charts, and line charts in minutes.
Access to ready-made graph templates for fast customization.
Recognizes and organizes your data automatically.
Accessible from desktop, Android, and iOS.
✅ Pros:
Free plan available with essential features.
No sign-up required to get started.
Graphs are designed to be visually impressive and presentation-ready.
Part of the Adobe family — smooth integration with other creative tools.
❌ Cons:
Free version is limited — premium features require a subscription.
Lacks collaborative editing tools for teams.
🎯 Best For: Designers, students, and marketers who want fast, beautiful graphs without heavy data customization.
10. Tableau
Tableau is one of the most powerful business intelligence and data visualization platforms on the market. It’s ideal for professionals who need advanced, interactive dashboards and in-depth analytics.
🔧 Key Features:
Connects with multiple data sources (Excel, SQL, Google Sheets, and more).
Supports real-time data sync and auto-updating dashboards.
Offers rich chart types, including grouped and stacked bar charts.
Drag-and-drop interface with deep customization and filtering options.
✅ Pros:
Extremely powerful for large and complex data sets.
Dashboards are interactive, responsive, and ideal for decision-making.
Widely used in enterprise environments; integrates with tools like Salesforce.
Large support community and free educational resources available.
❌ Cons:
Has a steep learning curve for beginners.
Free version (Tableau Public) comes with limitations.
Desktop version is relatively expensive and best suited for teams or organizations.
✅ Conclusion: Which Bar Graph Maker Should You Choose?
Whether you’re building a business report, student project, or data-driven pitch, having the right bar graph tool makes all the difference. Here’s a quick recap:
🎯 Best all-in-one tool for fast, professional slides → Decktopus
🧩 Best open-source graph generator → RawGraphs
💼 Best enterprise-level visualizations → Tableau
✏️ Best for design-focused content → Canva or Visme
Each bar chart creator on this list offers something unique—so choose based on your budget, needs, and how much customization you want.
Ready to start building beautiful data visualizations in minutes?
👉 Try Decktopus AI for free and turn your data into stunning presentations—automatically.
Frequently Asked Questions (FAQ)
1. How can I easily use a bar graph generator?
Most bar graph generators are user-friendly and require no prior experience.
If you’re looking for a quick and efficient solution, we highly recommend Decktopus. Just describe your topic and let Decktopus generate your slides, charts, and visuals automatically. No design skills needed.
2. Which bar graph makers are online and free?
There are many great online tools, but these stand out for their free features and ease of use:
✅ Decktopus – AI-powered, intuitive, and great for presentations
✅ RawGraphs – Open-source and powerful for custom data visualization
✅ Adobe Express – Offers pre-made templates with basic editing options
3. What is a Bar Graph Maker AI?
A bar graph maker AI is a tool that uses artificial intelligence to automate the creation of charts and graphs.
Instead of manually designing every detail, the AI generates visuals based on the data you provide.
Decktopus is a leading example. Describe your topic and AI generates charts, slides, and visuals automatically as part of your full presentation.
[[EMBED:PGRpdiBzdHlsZT0iYmFja2dyb3VuZDpsaW5lYXItZ3JhZGllbnQoMTM1ZGVnLCM0ZjYxZmYsIzdDM0FFRCk7Ym9yZGVyLXJhZGl1czoxNnB4O3BhZGRpbmc6MzJweCAyOHB4O3RleHQtYWxpZ246Y2VudGVyO21hcmdpbjoyOHB4IDA7Y29sb3I6I2ZmZiI+PGRpdiBzdHlsZT0iZm9udC1zaXplOjIycHg7Zm9udC13ZWlnaHQ6NzAwO2xpbmUtaGVpZ2h0OjEuMzttYXJnaW4tYm90dG9tOjhweCI+Q3JlYXRlIHlvdXIgbmV4dCBwcmVzZW50YXRpb24gd2l0aCBBSTwvZGl2PjxkaXYgc3R5bGU9ImZvbnQtc2l6ZToxNXB4O2xpbmUtaGVpZ2h0OjEuNTtvcGFjaXR5Oi45MjttYXJnaW46MCBhdXRvIDIwcHg7bWF4LXdpZHRoOjUyMHB4Ij5UdXJuIGFueSB0b3BpYyBpbnRvIGEgcG9saXNoZWQsIG9uLWJyYW5kIGRlY2sgaW4gbWludXRlcyB3aXRoIERlY2t0b3B1cy48L2Rpdj48YSBocmVmPSJodHRwczovL2FwcC5kZWNrdG9wdXMuY29tL3JlZ2lzdGVyIiB0YXJnZXQ9Il9ibGFuayIgcmVsPSJub29wZW5lciIgc3R5bGU9ImRpc3BsYXk6aW5saW5lLWJsb2NrO2JhY2tncm91bmQ6I2ZmZjtjb2xvcjojNGY2MWZmO3BhZGRpbmc6MTRweCAzMnB4O2JvcmRlci1yYWRpdXM6MTBweDtmb250LXdlaWdodDo2MDA7Zm9udC1zaXplOjE1cHg7dGV4dC1kZWNvcmF0aW9uOm5vbmUiPkdldCBTdGFydGVkIEZyZWU8L2E+PC9kaXY+]]

Decktopus Content Team
Related posts

How to Voice Record Audio on Powerpoint (Do a Voiceover)
This article shows you how to add and record audio/voice in PowerPoint presentation. It will cover the steps you need to take, and the software that is used.
Templates & How-to

About Me Powerpoint Template: A Simple, Easy To Use Template
Use this article as a guide while you prepare your about me PowerPoint presentation. Let’s go over the steps of creating an “about me presentation” while understanding common use cases and where should you use this kind of template.
Templates & How-to

Data Visualization: How Do You Create A Bar Graph? Examples and Bar Graph Definition
Explore the art of data visualization with our guide on creating impactful bar graphs. Learn the essentials, discover key features, and gain insights through practical examples, empowering you to effectively convey information visually.
Templates & How-to