Business & Strategy
How to Visualize and Present Project Roadmaps Using AI
Learn how to visualize and present project roadmaps using AI tools. Create clear timelines, color-code phases, and simplify stakeholder communication.

Waterfall methodology is a simple, straightforward way to create a project roadmap. You list down each phase in sequence and add its priorities, milestones, and tasks.
But presenting it to stakeholders gets tricky. How do you arrange the phases and show overlaps or dependencies? What colors should you use to make each phase stand out?
Manual tools like Excel or Google Sheets can be helpful, but they require a significant amount of formatting. You have to create shapes manually, align them with dates, and format cells to simulate a timeline. Plus, color-coding phases or visualizing overlapping events might require watching a tutorial.
AI design tools simplify the process of creating project roadmaps. You add the details, and the tool designs a professional project roadmap. In this blog post, we’ll explain how to use AI tools to visualize your roadmap and turn it into a clear, polished presentation.
What makes a good project roadmap?
A project roadmap should convey the project goals, milestones, and deliverables, so that your team knows how the project will progress and which tasks will take priority.
It also provides direction to your team when the project starts to go off track.
A good roadmap typically includes:
Phases: Broad stages of the project, like planning, execution, or rollout.
Milestones: Key decision points or checkpoints that mark progress.
Sequencing: A clear flow showing the timeline of each task.
Ownership: Team member responsible for each phase or task.
Here’s what a clear project roadmap looks like:
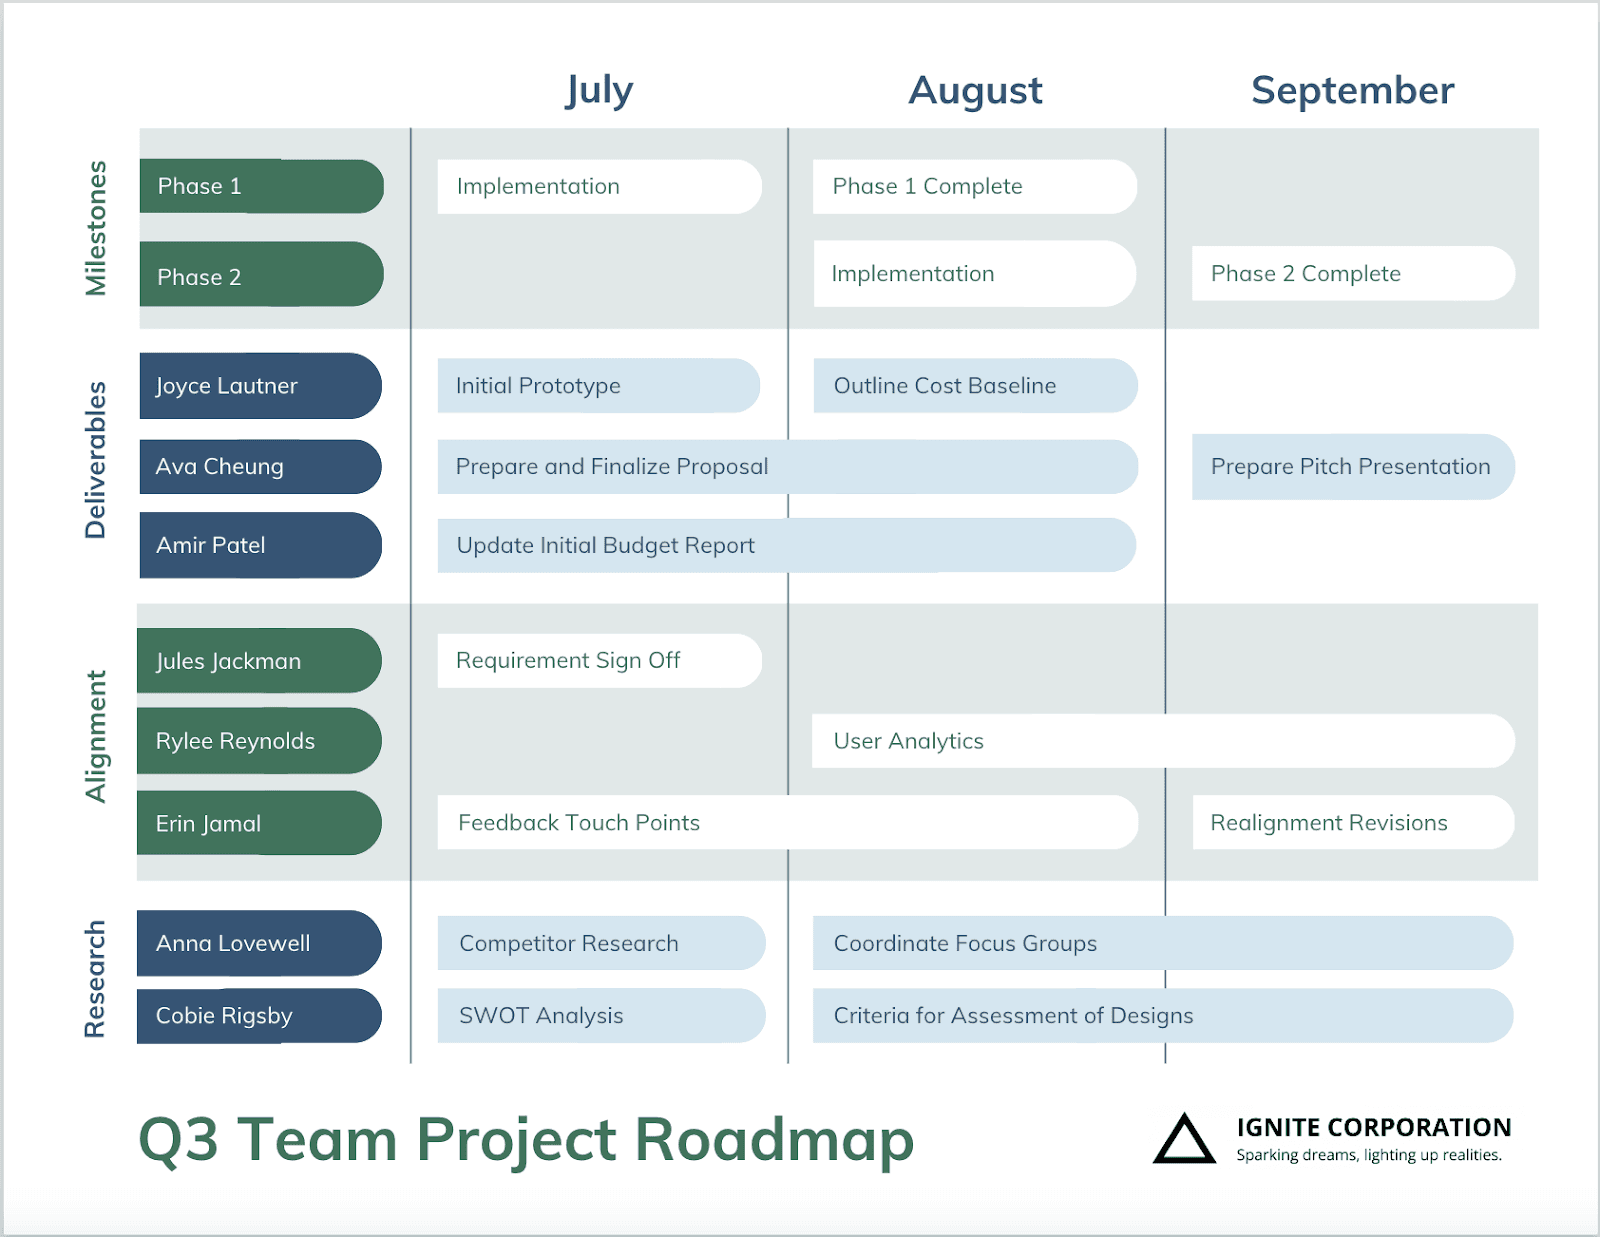
This roadmap shows:
The phases the project will go through
The key outcomes or milestones
When each stage is expected to happen
How the pieces connect and build on each other
Who is responsible for what
Structure your project roadmap before design
Before jumping into visual planning, map out the core structure of your project roadmap. This will help you provide a clear prompt to the AI tool.
Here’s a step-by-step breakdown of how to outline your project roadmap.
Step 1: Define the key project phases
List the broad stages based on your project requirement. For example, an app development project would include research, development, testing, and rollout stages. If you are working on a marketing project, your phases might look like campaign planning, content creation, asset production, and launch.
Step 2: Identify major milestones
After defining the phases, add deliverables, milestones, and timelines for each phase. Use clear, action-focused phrases, such as “UX prototype ready” or “Campaign live.”
Remember to follow a single format for phases — either weeks, months, or quarters. This creates consistency and makes it easier for AI tools to visualize your project roadmap.
Step 3: Choose your roadmap format
Now, decide the timeline flow (linear, overlapping, or cyclical) based on how your project will move. An app development project will have a linear roadmap. This requires sequential phases with clear start and end dates.
If you’re working on cross-functional projects, you’ll need an overlapping flow where different teams like design, content, and engineering work in parallel. And if your project repeats in cycles, like content production or onboarding programs, a cyclical format will give a better view of recurring phases.
Step 4: Set the time scale
Decide the time scale as per your project requirements — weeks, months, or quarters. For short-term sprints or detailed workflows, a weekly scale works best. If you have to work on mid-range projects like campaign rollouts or product launches, go with monthly timelines.
For long-term planning and recurring projects, use quarters to track broader goals. You can organize key goals and milestones over a 3-, 6-, or 12-month window.
Step 5: Assign ownership or dependencies
Assigning clear ownership to team members makes team communication and accountability much easier, especially during handoffs or overlapping phases. If certain tasks depend on others being completed first, note those dependencies in your structure. This helps team members stay in sync.
You can use this project timeline template as a reference for structuring your own project roadmap. Think about what details you need to include: phases, timelines, team ownership, and overlaps, and how they’ll appear visually in the final layout.

How to visualize project roadmaps
Instead of spending hours creating shapes, aligning dates, and formatting slides manually, you can generate professional project roadmaps by providing a simple text-based input to AI tools.
Step-by-step process to visualize your roadmap with AI:
Write your roadmap structure in a doc or spreadsheet: List your phases, deliverables, timelines, and team ownership in a Google or Word doc or sheet. You can also create a table for this.
Convert that into a prompt: Based on your structure, write a short prompt to create the project roadmap. For example: “Create a Gantt-style roadmap for a 5-week marketing campaign. Include four key phases, weekly timelines, and task owners.”
Paste the prompt into an AI tool: Use AI design tools like Venngage to generate visuals from text. Input your text prompt or upload your document with the project roadmap structure.
Customize the visual: Once the roadmap is generated in the form of a Gantt chart or infographic, you can easily adjust the layout, switch formats, update colors, or add icons to match your organization’s branding style.
Let’s see how you can visualize your project roadmap in different formats:
1. Infographic-style roadmap
Infographic roadmaps include major phases, outcomes, and timing without getting into too much detail. Use this when you need to share a roadmap with clients, leadership, or team members who don’t need task-level breakdowns.
It works great for communicating goals, milestones, and overall project direction. Think of this format as a strategic overview.
Here’s an example of an infographic-style project roadmap created using Venngage’s AI Timeline Generator.
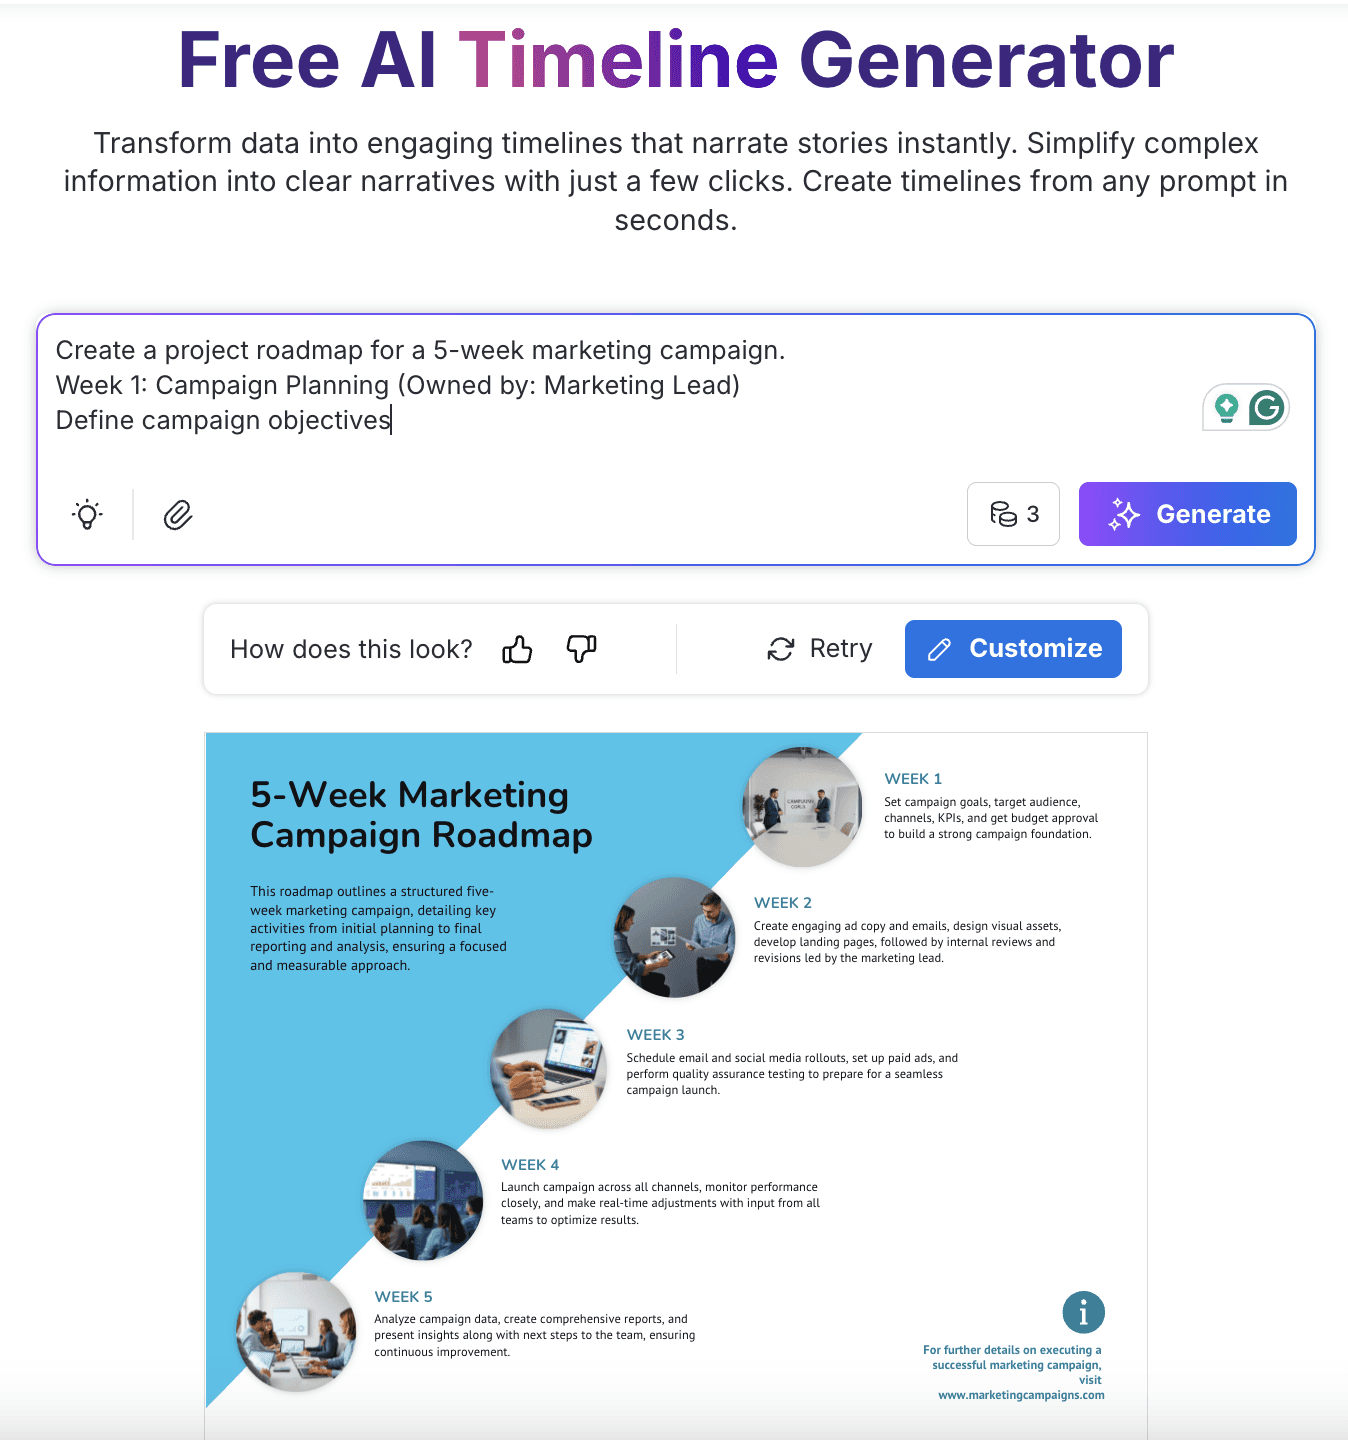
How to use Venngage’s AI Timeline Generator:
Input your structure in plain text.
Get an AI-generated project roadmap visual.
Customize colors, icons, and texts to match the tone.
Either add a text prompt or upload your document or sheet. Venngage’s AI tool will automatically extract the data and design the project roadmap.
2. Gantt-style roadmap
For linear project roadmaps, you can use Gantt charts. They are structured timelines that map tasks across a horizontal axis. You can see start and end dates, task duration, overlaps, and dependencies at a glance. This format works well for tracking projects on a week-by-week or phase-by-phase basis.
You need to include the duration of each phase, any overlapping workstreams, and task ownership in the prompt.

3. Cyclical roadmap
If you have a recurring project or one that doesn’t follow clear timelines, you can use a cyclical roadmap. It’s more suitable for onboarding programs, product iteration cycles, or monthly content calendars.
Just describe the repeating phases in your AI prompt.
For example: “Create a cyclical roadmap for a monthly onboarding workflow with phases like outreach, training, feedback, and iteration.”
This is how you can visualize a cyclical project roadmap with Venngage.

Presenting the roadmap to stakeholders
Your project roadmap visual is ready, and it’s time to share it with the stakeholders. Either download it in PDF or PNG format from the AI tool, or you can add the infographic to a presentation or deck for detailed discussion.
Create a short presentation or deck
A project roadmap visual usually provides an overview of tasks. So, if you want to communicate more details to your team and share project ideas, create a short presentation or deck.
With Decktopus, you can generate an AI-powered presentation in minutes. Just enter your topic, the purpose of the presentation, and your target audience. Pick a theme that fits your brand or message. Once the presentation is ready, you can add a new slide or customize an existing one. Add your roadmap visual where it fits best.

Add a contextual headline
Write a clear title in the slide “Where We’re Headed Next” or “Project Timeline Overview.” This gives your audience a clear idea of what they’re looking at.
You can also include a one-line subheading under the title to add a bit more context, such as “This roadmap outlines our key deliverables and deadlines across five weeks.”
Use one clean visual per roadmap
Insert the full visual (Gantt chart, timeline, or infographic-style layout) as a standalone image in one slide along with the heading. Avoid adding too much text or explanation to the same slide. You can add notes or extra details in different slides.
Break it down across slides if needed
If your roadmap has multiple phases or workstreams, don’t explain everything on one slide. Use follow-up slides to walk through the roadmap step by step.
You can structure the slide for each phase in the following manner:
Title: Phase name and timeline (e.g., “Week 2: Content Creation”).
Key deliverables: List what’s expected at this stage.
Milestones: Highlight what signals completion.
Dependencies: Mention if this phase relies on the starting or finishing of any other phase.
Ownership: Add which team or person is responsible.
This format makes it easier to explain the “why” behind each part of the roadmap without overloading a single slide.
Align visuals with your narrative flow
Walk through the roadmap in order. Instead of reading tasks or dates, explain how each phase contributes to the overall project goal.
For example: “Week 1 is focused on aligning objectives and locking the campaign theme. This gives the content and design teams a clear starting point before moving into asset creation in Week 2.”
You can also use transitions between slides to keep a natural flow. This will help your audience see the logic behind the sequencing, instead of just focusing on the dates.
Create project roadmaps with AI
Project roadmaps are essential for aligning your team, setting expectations, and kicking off with clarity. But visualizing them isn’t always straightforward.
It’s easy to get stuck trying to format phases, timelines, and milestones manually, especially when you’re short on time or working with multiple teams. That’s where AI tools can make a real difference.
With tools like Venngage, you can outline your roadmap in plain text and generate a clean, structured visual in minutes. Once it’s ready, you can drop it into your presentation, walk through each phase, and get everyone on the same page.

Decktopus Content Team
Related posts

4 Great Ways to Increase Your Customer Base
Attracting customers is hard. For many companies, getting enough traffic to their offers consistently is an uphill battle, which is one of the main reasons why 50% of businesses fail within the first five years.
Business & Strategy

5 Ways To Make Board Meetings More Valuable
Board meetings are evolving. Gone are the days when these meetings only revolved around Sales. Today, board meetings consist of a 360 view of the organization. They focus on the holistic performance of the company.
Business & Strategy

Revolutionize Education with Best AI Tools for Students: Uncover the Best AI Education Tools For Education
Unleash the power of artificial intelligence with AI tools in September. Discover how AI tools can enhance student experiences. Explore ClickUp's AI features for streamlined productivity.
Business & Strategy