Templates & How-to
Flow Chart Mastery: Effortless Communication Through Process Flow Diagrams - Crafting a Visual Blueprint for Seamless Processes
Unlocking Efficiency: Harmonizing Workflow with Flowcharts, Mapping Steps with Click-by-Click Precision and Visual Symbols in Visio Diagrams

Effortless Communication: How Flowcharts Enhance Team Collaboration
Embark on a visual journey through the intricate world of flow charts, where complex processes are simplified into streamlined pathways. In this exploration, we dive into the essence of flow charts, unraveling their significance in conveying information visually and methodically.
Whether you’re a seasoned professional seeking to enhance project management or a curious learner stepping into the realm of process visualization, this guide is your gateway to understanding the art and utility of flow charts.
Join us as we navigate through nodes, decision diamonds, and connectors to unveil the power of flow charts in organizing ideas, optimizing workflows, and transforming the way we comprehend intricate systems.
What Is A Flowchart?

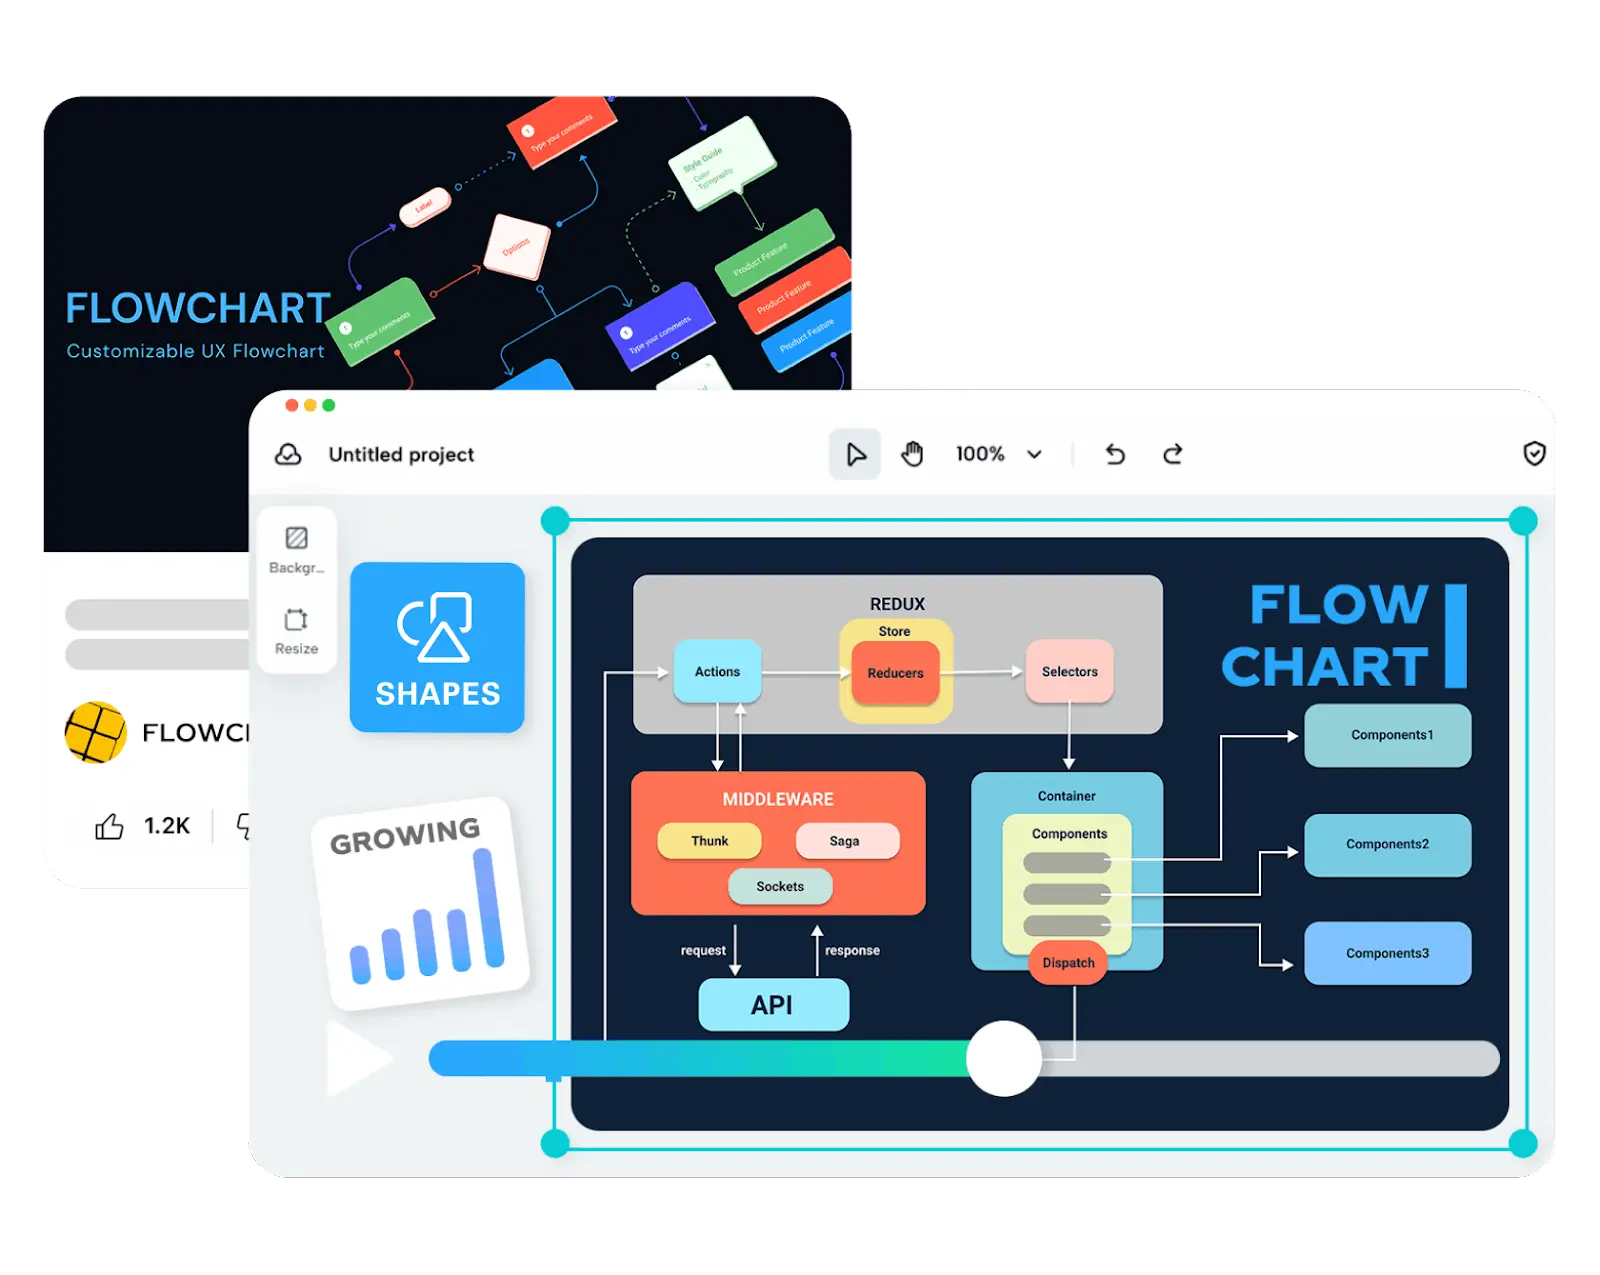
A flowchart is a graphic diagram that uses symbols to show the order of steps in a process. It makes complicated procedures easier to grasp by assisting with process visualization, analysis, and communication.
Rectangles are commonly used to represent actions, diamonds to represent decisions, and arrows to illustrate flow. Business, engineering, and project management professionals frequently utilize flowcharts to show operations, spot inefficiencies, and enhance procedures.
[[EMBED:PGlmcmFtZSBzcmM9Imh0dHBzOi8vd3d3LnlvdXR1YmUuY29tL2VtYmVkL2lKbWNnUVJrMDQ4IiB0aXRsZT0iWW91VHViZSB2aWRlbyIgZnJhbWVib3JkZXI9IjAiIGFsbG93PSJhY2NlbGVyb21ldGVyO2F1dG9wbGF5O2NsaXBib2FyZC13cml0ZTtlbmNyeXB0ZWQtbWVkaWE7Z3lyb3Njb3BlO3BpY3R1cmUtaW4tcGljdHVyZSIgYWxsb3dmdWxsc2NyZWVuIHN0eWxlPSJ3aWR0aDoxMDAlO2FzcGVjdC1yYXRpbzoxNi85O2JvcmRlcjowO2JvcmRlci1yYWRpdXM6MTJweDttYXJnaW46OHB4IDAiPjwvaWZyYW1lPg==]]
[[EMBED:PGRpdiBzdHlsZT0ib3ZlcmZsb3cteDphdXRvO21hcmdpbjoyMHB4IDAiPjx0YWJsZSBzdHlsZT0id2lkdGg6MTAwJTtib3JkZXItY29sbGFwc2U6Y29sbGFwc2U7Zm9udC1zaXplOjE1cHg7bWFyZ2luOjhweCAwIj48dHI+PHRoIHN0eWxlPSJib3JkZXI6MXB4IHNvbGlkICNlM2U2ZWE7cGFkZGluZzoxMHB4IDE0cHg7dGV4dC1hbGlnbjpsZWZ0O2JhY2tncm91bmQ6I2Y0ZjZmODtmb250LXdlaWdodDo2MDAiPlRlcm1pbmFsL1Rlcm1pbmF0b3I8L3RoPjwvdHI+PHRyPjx0ZCBzdHlsZT0iYm9yZGVyOjFweCBzb2xpZCAjZTNlNmVhO3BhZGRpbmc6MTBweCAxNHB4O3RleHQtYWxpZ246bGVmdDt2ZXJ0aWNhbC1hbGlnbjp0b3AiPlByb2Nlc3M8L3RkPjwvdHI+PHRyPjx0ZCBzdHlsZT0iYm9yZGVyOjFweCBzb2xpZCAjZTNlNmVhO3BhZGRpbmc6MTBweCAxNHB4O3RleHQtYWxpZ246bGVmdDt2ZXJ0aWNhbC1hbGlnbjp0b3AiPkRlY2lzaW9uPC90ZD48L3RyPjx0cj48dGQgc3R5bGU9ImJvcmRlcjoxcHggc29saWQgI2UzZTZlYTtwYWRkaW5nOjEwcHggMTRweDt0ZXh0LWFsaWduOmxlZnQ7dmVydGljYWwtYWxpZ246dG9wIj5Eb2N1bWVudDwvdGQ+PC90cj48dHI+PHRkIHN0eWxlPSJib3JkZXI6MXB4IHNvbGlkICNlM2U2ZWE7cGFkZGluZzoxMHB4IDE0cHg7dGV4dC1hbGlnbjpsZWZ0O3ZlcnRpY2FsLWFsaWduOnRvcCI+RGF0YSwgb3IgSW5wdXQvT3V0cHV0PC90ZD48L3RyPjx0cj48dGQgc3R5bGU9ImJvcmRlcjoxcHggc29saWQgI2UzZTZlYTtwYWRkaW5nOjEwcHggMTRweDt0ZXh0LWFsaWduOmxlZnQ7dmVydGljYWwtYWxpZ246dG9wIj5TdG9yZWQgRGF0YTwvdGQ+PC90cj48dHI+PHRkIHN0eWxlPSJib3JkZXI6MXB4IHNvbGlkICNlM2U2ZWE7cGFkZGluZzoxMHB4IDE0cHg7dGV4dC1hbGlnbjpsZWZ0O3ZlcnRpY2FsLWFsaWduOnRvcCI+RmxvdyBBcnJvdzwvdGQ+PC90cj48dHI+PHRkIHN0eWxlPSJib3JkZXI6MXB4IHNvbGlkICNlM2U2ZWE7cGFkZGluZzoxMHB4IDE0cHg7dGV4dC1hbGlnbjpsZWZ0O3ZlcnRpY2FsLWFsaWduOnRvcCI+Q29tbWVudCBvciBBbm5vdGF0aW9uPC90ZD48L3RyPjx0cj48dGQgc3R5bGU9ImJvcmRlcjoxcHggc29saWQgI2UzZTZlYTtwYWRkaW5nOjEwcHggMTRweDt0ZXh0LWFsaWduOmxlZnQ7dmVydGljYWwtYWxpZ246dG9wIj5QcmVkZWZpbmVkIHByb2Nlc3M8L3RkPjwvdHI+PHRyPjx0ZCBzdHlsZT0iYm9yZGVyOjFweCBzb2xpZCAjZTNlNmVhO3BhZGRpbmc6MTBweCAxNHB4O3RleHQtYWxpZ246bGVmdDt2ZXJ0aWNhbC1hbGlnbjp0b3AiPk9uLXBhZ2UgY29ubmVjdG9yL3JlZmVyZW5jZTwvdGQ+PC90cj48dHI+PHRkIHN0eWxlPSJib3JkZXI6MXB4IHNvbGlkICNlM2U2ZWE7cGFkZGluZzoxMHB4IDE0cHg7dGV4dC1hbGlnbjpsZWZ0O3ZlcnRpY2FsLWFsaWduOnRvcCI+T2ZmLXBhZ2UgY29ubmVjdG9yL3JlZmVyZW5jZTwvdGQ+PC90cj48L3RhYmxlPjwvZGl2Pg==]]
As a visual representation of data flow, flowcharts are useful in writing a program or algorithm and explaining it to others or collaborating with them on it. You can use an algorithm flowchart to spell out the logic behind a program before ever starting to code the automated process. It can help to organize big-picture thinking and provide a guide when it comes time to code. More specifically, flowcharts can:
Demonstrate the way code is organized.
Visualize the execution of code within a program.
Show the structure of a website or application.
Understand how users navigate a website or program.
[[EMBED:PGRpdiBzdHlsZT0ib3ZlcmZsb3cteDphdXRvO21hcmdpbjoyMHB4IDAiPjx0YWJsZSBzdHlsZT0id2lkdGg6MTAwJTtib3JkZXItY29sbGFwc2U6Y29sbGFwc2U7Zm9udC1zaXplOjE1cHg7bWFyZ2luOjhweCAwIj48dHI+PHRoIHN0eWxlPSJib3JkZXI6MXB4IHNvbGlkICNlM2U2ZWE7cGFkZGluZzoxMHB4IDE0cHg7dGV4dC1hbGlnbjpsZWZ0O2JhY2tncm91bmQ6I2Y0ZjZmODtmb250LXdlaWdodDo2MDAiPkFOU0kvSVNPIFNoYXBlPC90aD48dGggc3R5bGU9ImJvcmRlcjoxcHggc29saWQgI2UzZTZlYTtwYWRkaW5nOjEwcHggMTRweDt0ZXh0LWFsaWduOmxlZnQ7YmFja2dyb3VuZDojZjRmNmY4O2ZvbnQtd2VpZ2h0OjYwMCI+TmFtZTwvdGg+PC90cj48dHI+PHRkIHN0eWxlPSJib3JkZXI6MXB4IHNvbGlkICNlM2U2ZWE7cGFkZGluZzoxMHB4IDE0cHg7dGV4dC1hbGlnbjpsZWZ0O3ZlcnRpY2FsLWFsaWduOnRvcCI+Rmxvd2xpbmUgKEFycm93aGVhZCk8L3RkPjx0ZCBzdHlsZT0iYm9yZGVyOjFweCBzb2xpZCAjZTNlNmVhO3BhZGRpbmc6MTBweCAxNHB4O3RleHQtYWxpZ246bGVmdDt2ZXJ0aWNhbC1hbGlnbjp0b3AiPlNob3dzIHRoZSBwcm9jZXNzJ3Mgb3JkZXIgb2Ygb3BlcmF0aW9uLiBBIGxpbmUgY29taW5nIGZyb20gb25lIHN5bWJvbCBhbmQgcG9pbnRpbmcgYXQgYW5vdGhlci4gQXJyb3doZWFkcyBhcmUgYWRkZWQgaWYgdGhlIGZsb3cgaXMgbm90IHRoZSBzdGFuZGFyZCB0b3AtdG8tYm90dG9tLCBsZWZ0LXRvIHJpZ2h0LjwvdGQ+PC90cj48dHI+PHRkIHN0eWxlPSJib3JkZXI6MXB4IHNvbGlkICNlM2U2ZWE7cGFkZGluZzoxMHB4IDE0cHg7dGV4dC1hbGlnbjpsZWZ0O3ZlcnRpY2FsLWFsaWduOnRvcCI+VGVybWluYWw8L3RkPjx0ZCBzdHlsZT0iYm9yZGVyOjFweCBzb2xpZCAjZTNlNmVhO3BhZGRpbmc6MTBweCAxNHB4O3RleHQtYWxpZ246bGVmdDt2ZXJ0aWNhbC1hbGlnbjp0b3AiPkluZGljYXRlcyB0aGUgYmVnaW5uaW5nIGFuZCBlbmRpbmcgb2YgYSBwcm9ncmFtIG9yIHN1Yi1wcm9jZXNzLiBSZXByZXNlbnRlZCBhcyBhIHN0YWRpdW0sIG92YWwsIG9yIHJvdW5kZWQgKGZpbGxldCkgcmVjdGFuZ2xlLiBUaGV5IHVzdWFsbHkgY29udGFpbiB0aGUgd29yZCAiU3RhcnQiIG9yICJFbmQsIiBvciBhbm90aGVyIHBocmFzZSBzaWduYWxpbmcgdGhlIHN0YXJ0IG9yIGVuZCBvZiBhIHByb2Nlc3MsIHN1Y2ggYXMgInN1Ym1pdCBpbnF1aXJ5IiBvciAicmVjZWl2ZSBwcm9kdWN0LiI8L3RkPjwvdHI+PHRyPjx0ZCBzdHlsZT0iYm9yZGVyOjFweCBzb2xpZCAjZTNlNmVhO3BhZGRpbmc6MTBweCAxNHB4O3RleHQtYWxpZ246bGVmdDt2ZXJ0aWNhbC1hbGlnbjp0b3AiPlByb2Nlc3M8L3RkPjx0ZCBzdHlsZT0iYm9yZGVyOjFweCBzb2xpZCAjZTNlNmVhO3BhZGRpbmc6MTBweCAxNHB4O3RleHQtYWxpZ246bGVmdDt2ZXJ0aWNhbC1hbGlnbjp0b3AiPlJlcHJlc2VudHMgYSBzZXQgb2Ygb3BlcmF0aW9ucyB0aGF0IGNoYW5nZXMgdGhlIHZhbHVlLCBmb3JtLCBvciBsb2NhdGlvbiBvZiBkYXRhLiBSZXByZXNlbnRlZCBhcyBhIHJlY3RhbmdsZS48L3RkPjwvdHI+PHRyPjx0ZCBzdHlsZT0iYm9yZGVyOjFweCBzb2xpZCAjZTNlNmVhO3BhZGRpbmc6MTBweCAxNHB4O3RleHQtYWxpZ246bGVmdDt2ZXJ0aWNhbC1hbGlnbjp0b3AiPkRlY2lzaW9uPC90ZD48dGQgc3R5bGU9ImJvcmRlcjoxcHggc29saWQgI2UzZTZlYTtwYWRkaW5nOjEwcHggMTRweDt0ZXh0LWFsaWduOmxlZnQ7dmVydGljYWwtYWxpZ246dG9wIj5TaG93cyBhIGNvbmRpdGlvbmFsIG9wZXJhdGlvbiB0aGF0IGRldGVybWluZXMgd2hpY2ggb25lIG9mIHRoZSB0d28gcGF0aHMgdGhlIHByb2dyYW0gd2lsbCB0YWtlLiBUaGUgb3BlcmF0aW9uIGlzIGNvbW1vbmx5IGEgeWVzL25vIHF1ZXN0aW9uIG9yIHRydWUvZmFsc2UgdGVzdC4gUmVwcmVzZW50ZWQgYXMgYSBkaWFtb25kIChyaG9tYnVzKS48L3RkPjwvdHI+PHRyPjx0ZCBzdHlsZT0iYm9yZGVyOjFweCBzb2xpZCAjZTNlNmVhO3BhZGRpbmc6MTBweCAxNHB4O3RleHQtYWxpZ246bGVmdDt2ZXJ0aWNhbC1hbGlnbjp0b3AiPklucHV0L091dHB1dDwvdGQ+PHRkIHN0eWxlPSJib3JkZXI6MXB4IHNvbGlkICNlM2U2ZWE7cGFkZGluZzoxMHB4IDE0cHg7dGV4dC1hbGlnbjpsZWZ0O3ZlcnRpY2FsLWFsaWduOnRvcCI+SW5kaWNhdGVzIHRoZSBwcm9jZXNzIG9mIGlucHV0dGluZyBhbmQgb3V0cHV0dGluZyBkYXRhLCBhcyBpbiBlbnRlcmluZyBkYXRhIG9yIGRpc3BsYXlpbmcgcmVzdWx0cy4gUmVwcmVzZW50ZWQgYXMgYSByaG9tYm9pZC48L3RkPjwvdHI+PHRyPjx0ZCBzdHlsZT0iYm9yZGVyOjFweCBzb2xpZCAjZTNlNmVhO3BhZGRpbmc6MTBweCAxNHB4O3RleHQtYWxpZ246bGVmdDt2ZXJ0aWNhbC1hbGlnbjp0b3AiPkFubm90YXRpb24gKENvbW1lbnQpPC90ZD48dGQgc3R5bGU9ImJvcmRlcjoxcHggc29saWQgI2UzZTZlYTtwYWRkaW5nOjEwcHggMTRweDt0ZXh0LWFsaWduOmxlZnQ7dmVydGljYWwtYWxpZ246dG9wIj5JbmRpY2F0aW5nIGFkZGl0aW9uYWwgaW5mb3JtYXRpb24gYWJvdXQgYSBzdGVwIGluIHRoZSBwcm9ncmFtLiBSZXByZXNlbnRlZCBhcyBhbiBvcGVuIHJlY3RhbmdsZSB3aXRoIGEgZGFzaGVkIG9yIHNvbGlkIGxpbmUgY29ubmVjdGluZyBpdCB0byB0aGUgY29ycmVzcG9uZGluZyBzeW1ib2wgaW4gdGhlIGZsb3djaGFydC48L3RkPjwvdHI+PHRyPjx0ZCBzdHlsZT0iYm9yZGVyOjFweCBzb2xpZCAjZTNlNmVhO3BhZGRpbmc6MTBweCAxNHB4O3RleHQtYWxpZ246bGVmdDt2ZXJ0aWNhbC1hbGlnbjp0b3AiPlByZWRlZmluZWQgUHJvY2VzczwvdGQ+PHRkIHN0eWxlPSJib3JkZXI6MXB4IHNvbGlkICNlM2U2ZWE7cGFkZGluZzoxMHB4IDE0cHg7dGV4dC1hbGlnbjpsZWZ0O3ZlcnRpY2FsLWFsaWduOnRvcCI+U2hvd3MgbmFtZWQgcHJvY2VzcyB3aGljaCBpcyBkZWZpbmVkIGVsc2V3aGVyZS4gUmVwcmVzZW50ZWQgYXMgYSByZWN0YW5nbGUgd2l0aCBkb3VibGUtc3RydWNrIHZlcnRpY2FsIGVkZ2VzLjwvdGQ+PC90cj48dHI+PHRkIHN0eWxlPSJib3JkZXI6MXB4IHNvbGlkICNlM2U2ZWE7cGFkZGluZzoxMHB4IDE0cHg7dGV4dC1hbGlnbjpsZWZ0O3ZlcnRpY2FsLWFsaWduOnRvcCI+T24tcGFnZSBDb25uZWN0b3I8L3RkPjx0ZCBzdHlsZT0iYm9yZGVyOjFweCBzb2xpZCAjZTNlNmVhO3BhZGRpbmc6MTBweCAxNHB4O3RleHQtYWxpZ246bGVmdDt2ZXJ0aWNhbC1hbGlnbjp0b3AiPlBhaXJzIG9mIGxhYmVsZWQgY29ubmVjdG9ycyByZXBsYWNlIGxvbmcgb3IgY29uZnVzaW5nIGxpbmVzIG9uIGEgZmxvd2NoYXJ0IHBhZ2UuIFJlcHJlc2VudGVkIGJ5IGEgc21hbGwgY2lyY2xlIHdpdGggYSBsZXR0ZXIgaW5zaWRlLjwvdGQ+PC90cj48dHI+PHRkIHN0eWxlPSJib3JkZXI6MXB4IHNvbGlkICNlM2U2ZWE7cGFkZGluZzoxMHB4IDE0cHg7dGV4dC1hbGlnbjpsZWZ0O3ZlcnRpY2FsLWFsaWduOnRvcCI+T2ZmLXBhZ2UgQ29ubmVjdG9yPC90ZD48dGQgc3R5bGU9ImJvcmRlcjoxcHggc29saWQgI2UzZTZlYTtwYWRkaW5nOjEwcHggMTRweDt0ZXh0LWFsaWduOmxlZnQ7dmVydGljYWwtYWxpZ246dG9wIj5BIGxhYmVsZWQgY29ubmVjdG9yIGZvciB1c2Ugd2hlbiB0aGUgdGFyZ2V0IGlzIG9uIGFub3RoZXIgcGFnZS4gUmVwcmVzZW50ZWQgYXMgYSBob21lIHBsYXRlLXNoYXBlZCBwZW50YWdvbi48L3RkPjwvdHI+PC90YWJsZT48L2Rpdj4=]]
Applications of Flow Charting
1.Process Documentation:
Clearly illustrate and document complex processes to enhance understanding and analysis.
2. Project Planning:
Plan and visualize project tasks, dependencies, and timelines for efficient project management.
3. Algorithm Design:
Design algorithms and logic structures for programming and computational tasks.
4. Software Development:
Map out software processes, program workflows, and decision trees for development projects.
5. System Architecture:
Visualize the architecture of systems, illustrating components and their interactions.

6. Quality Control:
Identify and streamline quality control processes, ensuring consistency and accuracy.
7. Business Analysis:
Analyze and improve business processes, identifying areas for optimization and efficiency.
8. Troubleshooting Guides:
Create step-by-step guides for troubleshooting issues and resolving problems.
9. Decision-Making Processes:
Guide decision-making processes by visually representing different scenarios and outcomes.
10. Employee Onboarding:
Streamline and illustrate onboarding processes, helping new employees understand procedures.
Tips and Tricks for Flow Chart Design
Flowchart design is a powerful tool for understanding and visualizing complex processes and systems. However, to create an effective flowchart, there are some important tips and tricks to consider. Here are key strategies for flowchart design:
1. Define the Objectives:
Clearly define the purpose of your flowchart. Are you explaining a process, illustrating a decision tree, or portraying a system’s workflow?
2. Use Simple and Understandable Symbols:
Employ basic symbols to enhance the comprehensibility of your flowchart. Choose symbols that adhere to relevant industry standards.
3. Maintain a Logical Flow:
Organize steps in a sequential and logical order. Ensure that arrows point in the correct direction.
4. Add Descriptions:
Include descriptions for each step or decision point. This aids readers in better comprehending the process.
5. Strategically Use Colors:
Use colors in a meaningful and attention-catching way. For instance, group similar tasks using the same color.
6. Sketch on Paper First:
Outline the main structure by sketching on paper initially. Then, transition to a digital environment.
7. Collaborate with Stakeholders:
Ensure that the flowchart is understood by collaborating with relevant stakeholders. Their input is crucial for an accurate representation of the process.
8. Keep It on One Page:
If possible, keep your flowchart on a single page. If this is not achievable, add connector symbols to clearly indicate connections.
9. Maintain Relevance:
Update the flowchart as the process evolves or improves. Avoid confusion by not incorporating outdated or irrelevant information.
10. Test:
Test your created flowchart. Gather feedback on clarity and accuracy, and make necessary adjustments.
These tips aim to provide practical insights and strategies for individuals interested in effective flowchart design. Remember, each flowchart should be tailored to its unique requirements.
[[EMBED:PGlmcmFtZSBzcmM9Imh0dHBzOi8vd3d3LnlvdXR1YmUuY29tL2VtYmVkL3dMa3Z2cXlwcTFFIiB0aXRsZT0iWW91VHViZSB2aWRlbyIgZnJhbWVib3JkZXI9IjAiIGFsbG93PSJhY2NlbGVyb21ldGVyO2F1dG9wbGF5O2NsaXBib2FyZC13cml0ZTtlbmNyeXB0ZWQtbWVkaWE7Z3lyb3Njb3BlO3BpY3R1cmUtaW4tcGljdHVyZSIgYWxsb3dmdWxsc2NyZWVuIHN0eWxlPSJ3aWR0aDoxMDAlO2FzcGVjdC1yYXRpbzoxNi85O2JvcmRlcjowO2JvcmRlci1yYWRpdXM6MTJweDttYXJnaW46OHB4IDAiPjwvaWZyYW1lPg==]]
Great flow charts can also be created with Decktopus, here is an example flow chart deck created with Decktopus’s advanced artificial intelligence system:
[[EMBED:PGRpdiBzdHlsZT0ibWFyZ2luOjIwcHggMCI+PGlmcmFtZSBhbGxvd2Z1bGxzY3JlZW4gc3JjPSJodHRwczovL2RlY2t0b3AudXMvVHpBcUNQV0ZvP2VtYmVkZGVkPXRydWUiIHN0eWxlPSJwb3NpdGlvbjogYWJzb2x1dGU7IHRvcDogMDsgbGVmdDogMDsgd2lkdGg6IDEwMCU7IGhlaWdodDoxMDAlOyBib3JkZXI6bm9uZSI+PC9pZnJhbWU+PC9kaXY+]]
The Role of Creating Flow Charts in Business Processes
Advantages of Using Flow Process Diagram to Optimize Business Processes
Flowcharts play a crucial role in understanding, optimizing, and visualizing business processes. These graphical representations serve as powerful tools to enhance comprehension and improvement of an organization’s operations. Let’s take a closer look at the key role of flowcharts in business flow chart templates.
Optimizing business processes, increasing efficiency, and utilizing resources more effectively come with numerous advantages when employing flowcharts. Here are some of these advantages:
1. Visual Representation:
Flowcharts visually represent complex business processes, aiding employees and stakeholders in understanding the entirety of the process.
2. Error Reduction:
Presenting business processes step by step helps identify and correct potential errors.
3. Facilitating Decision-Making:
Flowcharts highlight decision points, guiding managers in making more informed decisions.
4. Education and Communication Tool:

5. Guiding Process Flow Diagramming Improvement:
In the process of evaluating and improving existing business processes, flowcharts provide a roadmap.
6. Effectiveness in Resource Management:
Flowcharts assist in optimizing resource usage, contributing to more efficient management of business processes. You can use flowchart maker.
7. Proactive Problem Solving:
Used for preventive maintenance and continuous improvement, flowcharts help identify potential issues before they arise.
As we reach the endpoint of our exploration into the realm of flow charts, it becomes evident that these visual tools are not merely diagrams but strategic instruments shaping the landscape of efficient communication.
Related diagrams used in computer software include:
Unified Modeling Language (UML): This is a general-purpose language used in software engineering for modeling.
Nassi-Shneiderman Diagrams: Used for structured computer programming. Named after Isaac Nassi and Ben Shneiderman, who developed it in 1972 at SUNY-Stony Brook. Also called Structograms.
DRAKON charts: DRAKON is an algorithmic visual programming language used to produce flowcharts examples.
From simplifying complex processes to aiding decision-making, flow charts stand as indispensable assets in diverse fields. As you harness the knowledge gained from this journey, may you integrate the art of flow charting into your endeavors, unlocking the potential for clarity, efficiency, and innovation.
Whether mapping out business processes, designing software workflows, or conceptualizing ideas, let the flow chart be your guide in navigating the intricacies of organization and optimization. Here’s to charting a path to success through the dynamic and versatile world of flow charts.
How to create flow process charts in different sectors?
In any field:
Document and analyze a process.
Standardize a process for efficiency and quality.
Communicate a process for training or understanding by other parts of the organization.
Identify bottlenecks, redundancies and unnecessary steps in a process and improve it.
Education:
Plan coursework and academic requirements.
Create a lesson plan or oral presentation.
Organize a group or individual project.
Show a legal or civil process, like voter registration.
Plan and structure creative writing, like lyrics or poetry.
Demonstrate character development for literature and film.
Represent the flow of algorithms or logic puzzles.
Understand a scientific process, like the Krebs cycle.
Chart an anatomical process, such as digestion.
Map out symptoms and treatment for diseases/disorders.
Communicate hypotheses and theories, like Maslow’s hierarchy of needs.
Sales and marketing:
Plot out the flow of a survey.
Chart a sales process.
Plan research strategies.
Show registration flows.
Disseminate communication policies, like an emergency PR plan.
Business:
Understand order and procurement processes.
Represent an employee’s tasks or daily routine.
Understand the paths that users take on a website or in a store.
Develop a business plan or product realization plan.
Document a process map templates in preparation for an audit, including for regulatory compliance, such as under the Sarbanes-Oxley Act.
Document a process in preparation for a sale or consolidation.
Manufacturing:
Denote the physical or chemical makeup of a product.
Illustrate the manufacturing process from beginning to end.
Discover and solve inefficiencies in a manufacturing or procurement process.
Engineering:
Represent process flows or system flows.
Design and update chemical and plant processes.
Assess the life cycle of a structure.
Chart a reverse-engineering flow.
Demonstrate the design and prototype phase of a new structure or product.
Frequently Asked Questions (Q&A)

1) What is a process flowchart and flowchart types?
A flow chart (also called a process flow chart template diagram or process map) is a diagram that depicts the steps in a process and their order. In quality improvement, two types of flow charts are used. A high-level flowchart diagrams provides a high-level view of a process by outlining 6-10 major steps.
2) What is flowchart system?
A system flowchart depicts how different parts of a system interact by displaying how data flows through the system and how decisions influence this process. Diagram of an event. Event diagrams depict a series of events and their causal relationship to a process.
3) Do I need a flowchart?
Flowcharts can assist you in identifying the key steps in a process while also providing a larger view of the process when creating and organizing it. It groups the jobs according to type process, decision, data model, etc. and arranges them chronologically.
4) Can you create a flowchart?
Clarifying the goal of the flowchart, selecting a good template, adding pertinent shapes and symbols, and linking them with lines and arrows are the best ways to begin creating one.
5) How to draw a flowchart and program flowchart?
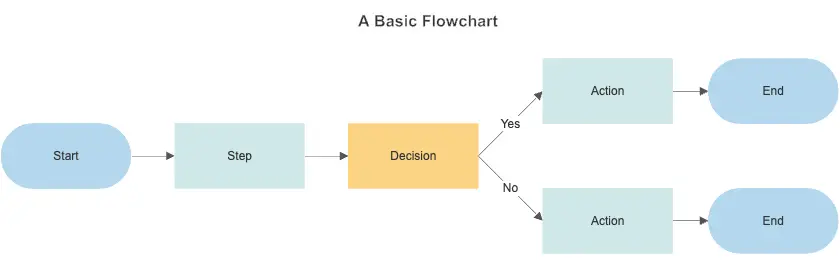
Give a precise definition of the procedure. For start and finish points, use ovals. Use rectangles to depict actions. For decision points, use diamonds. To illustrate the flow, join shapes with arrows. For input/output, use parallelograms. Annotate any explanations that are needed. Verify the accuracy and clarity. Make consistent use of colors and symbols.
6) What is types of flow charts according to different books?
Sterneckert, in his 2003 book Critical Incident Management , listed four popular flowchart types, framed around the concept of flow controls rather than the flow itself:
Document Flowcharts: These “have the purpose of showing existing controls over document-flow through the components of a system. … The chart is read from left to right and documents the flow of documents through the various business units.”
Data Flowcharts: These show “the controls governing data flows in a system. … Data flow diagrams are used primarily to show the channels that data is transmitted through the system rather than how controls flow.”
System Flowcharts: These “show the flow of data to and through the major components of a system such as data entry, programs, storage media, processors, and communication networks.”
Program Flowcharts: These show “the controls placed internally to a program within a system.”
Veronis , in his 1978 book Microprocessors: Design and Applications , outlined three flowchart types based on scope and level of detail:
System Flowchart: Identifies the devices to be used.
General Flowchart: Overview.
Detailed Flowchart: Increased detail.
Bohl, in her 1978 book A Guide for Programmers, listed only two:
System Flowchart.
Program Flowchart.
But Fryman, in his 2001 book Quality and Process Improvement , differentiated the types in multiple ways from more of a business perspective than a computer perspective:
Decision Flowchart.
Logic Flowchart.
Systems Flowchart.
Product Flowchart.
Process Flowchart.
Additional flowchart types defined by others include:
Swimlane Diagram, a.k.a Swimlane Flowchart: To delineate who does what in cross-team processes.
Workflow Flowchart: To document workflows, often involving tasks, documents and information in offices.
Event-Driven Process Chain (EPC) Flowchart: To document or plan a business process.
Specification and Description Language (SDL) Flowchart: To brainstorm computer algorithms using three basic components: system definition, block and process.
These related diagram shapes are also sometimes thought of as types of flowcharts:
Data Flow Diagram (DFD): To map out the flow of information for any system or process.
Process Flow Diagram (PFD), a.k.a. Process Flowchart: To illustrate the relationships between major components at an industrial plant.
Business Process Model and Notation (BPMN 2.0): To model the steps of a planned business process.
7) How to plan and draw a basic flowchart?
Define your purpose and scope. What do you hope to accomplish? Are you studying the right things with appropriate start and end points to accomplish that purpose? Be detailed enough in your research but simple enough in your charting to communicate with your intended audience.
Identify the tasks in chronological order. This might involve talking to participants, observing a process and/or reviewing any existing documentation. You might write out the steps in note form, or begin a rough chart.
Organize them by type and corresponding shape, such as process, decision, data, inputs or outputs.
Draw your chart, either sketching by hand or using a program such as Lucidchart.
Confirm your flowchart, walking through the steps with people who participate in the process. Observe the process to make sure you haven’t missed anything important to your purpose.
8) When to Use a Flowchart?
To develop understanding of how a process is done
To study a process for improvement
To communicate to others how a process is done
When better communication is needed between people involved with the same process
To document a process
When planning a project flow chart templates
9) What is Flowchart used for?
Flowcharts are used to design and document simple processes or programs. Like other types of diagrams, they help visualize the process. Two of the many benefits are flaws and bottlenecks may become apparent. Flowcharts typically use the following main symbols:
A process step, usually called an activity , is denoted by a rectangular box.
A decision is usually denoted by a diamond.
Here are some of the ways flowcharts are used today.
Project planning
Program or system design through flowchart programming
Process documentation
Audit a process for inefficiencies or malfunctions
Map computer algorithms
Documenting workflow
10) What are the Flowchart considerations?
Don’t worry about drawing the flowchart the “right way.” Ultimately, the right way is the way that helps those involved understand the process.
Identify and involve in the flowcharting process all key people involved with the process. This includes suppliers, customers, and supervisors. Involve them in the actual flowcharting sessions by interviewing them before the sessions and/or by showing them the developing flowchart between work sessions and obtaining their feedback.
Do not assign a “technical expert” to draw the flowchart. People who actually perform the process should do it.
11) In what situations do flow chart templates work?
Flow chart templates work for all kinds of situations, including:
In-house employees looking to simplify processes
Freelancers planning projects
Consultants managing client workflow
Entrepreneurs starting businesses
Small business owners managing employee progress

Decktopus Content Team


