
.svg)
.svg)
.svg)


.svg)


What Is Flow Chart?

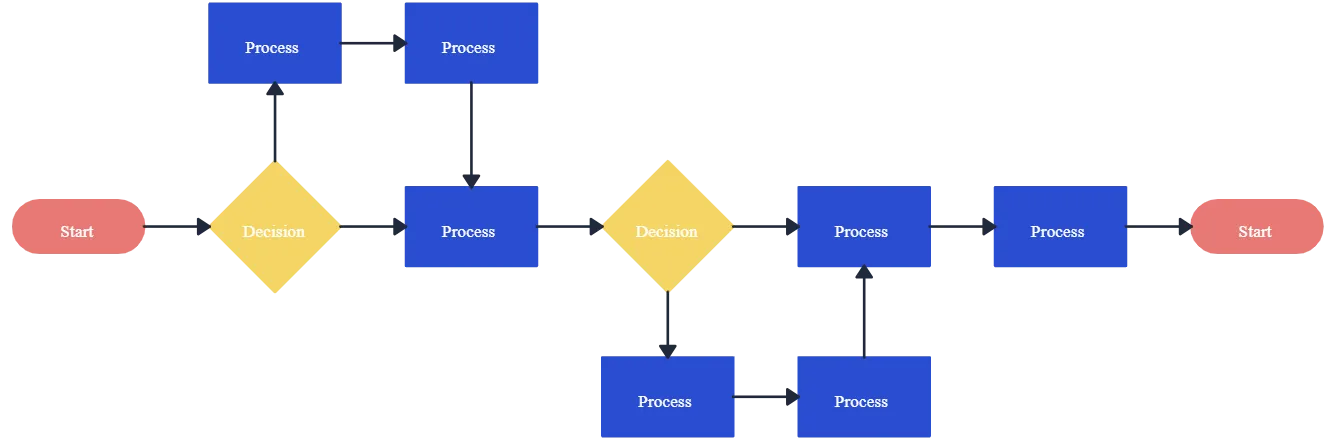
A flowchart is a graphical representation of a process, system, or algorithm. It uses different shapes and symbols to represent different types of steps or actions, and it shows the flow of control or data among these steps. Flowcharts are commonly used in various fields, including computer programming, business process analysis, engineering, and project management, to visually represent and communicate complex processes.
The basic components of process map template flowchart include:
- Start/End: Represents the beginning or end of a process.
- Process: Represents a specific task or activity in the process.
- Decision: Represents a decision point where a choice is made, leading to different paths in the flowchart.
- Input/Output: Represents the input or output of data.
- Connector: Connects different parts of the flowchart and indicates the flow of control or information.
- Flow Arrows: Arrows show the direction of flow from one step to the next.
Flowcharts help in understanding, documenting, and improving processes. They are also useful for training, troubleshooting, and communicating complex procedures in a visual and easy-to-understand format. Flowcharts come in various types, such as system flowcharts, data flow diagrams, and business process modeling diagrams, each serving different purposes based on the context and the level of detail needed.
Usage Areas Of Flow Charts
Flowcharts are versatile visual tools that find applications in various fields. Some common usage areas include:
1) Programming and Software Development
Flowcharts are widely used in software development to represent algorithms and program logic. They help programmers visualize the flow of control and logic in a program.
2) Business Process Modeling
Organizations use flowcharts to document and analyze their business processes. This helps in identifying inefficiencies, bottlenecks, and opportunities for improvement.
3) Project Management
Flowcharts are used in project planning to outline the sequence of tasks and activities. This helps project managers and team members understand the workflow and dependencies.
4) Quality Control and Process Improvement
In manufacturing and other industries, flowcharts are used to document and improve processes. This is crucial for quality control and continuous improvement initiatives.
5) Education and Training
Flowcharts are used as educational tools to teach students about algorithms, decision-making processes, and system design. They simplify complex concepts and make them more accessible.
6) Data Analysis and System Design
In systems analysis and design, flowcharts help in visualizing data flows, system interactions, and the overall architecture of a system.
7) Network Diagrams
Flowcharts are used to represent network architectures and communication flows in computer networks.
8) Medical and Healthcare Processes
In healthcare, flowcharts can illustrate patient care processes, decision-making pathways, and treatment protocols.
9) Financial Processes
Flowcharts are employed in finance to represent financial processes, such as budgeting, accounting procedures, and financial decision-making.
10) Troubleshooting and Decision Analysis
Flowcharts are useful in troubleshooting procedures by visually representing possible scenarios and decision points. They aid in decision analysis by outlining the consequences of different choices.
11) Legal Processes
Flowcharts can be used in legal settings to represent legal processes, decision trees, and case workflows.
12) Emergency Response Planning
Flowcharts are utilized in emergency response planning to outline procedures and decision-making steps during crises.
The Features Of A Flow Chart

1) Shapes and Symbols: Flowcharts use different shapes and symbols to represent specific actions or steps in a process. Common shapes include rectangles (for processes), diamonds (for decisions), ovals (for start/end points), and arrows (indicating the flow direction).
2) Start and End Points: The flowchart begins with a start point (often represented by an oval) and ends with an end point or termination (another oval or a rectangle).
3) Processes: Rectangles are used to represent processes or tasks. Each rectangle typically contains a description of the activity or task to be performed.
4) Decision Points: Diamonds are used to represent decision points in the process. The flow can diverge based on a condition, and different paths are usually labeled with yes/no or true/false conditions.
5) Connectors: Arrows and lines connect the different shapes, indicating the flow of control or data between steps. Connectors show the sequence in which the steps or processes occur.
6) Input/Output: Parallelograms are often used to represent input or output in a process. They indicate where data is input into the process or where results are generated as output.
7) Annotations and Comments: Additional text or comments can be added to provide more information or clarification about specific steps or decision points.
8) Parallel and Merge: Parallel lines can be used to indicate parallel processes or activities happening simultaneously. A merge symbol shows the point where parallel paths converge.
9) Off-Page Connector: This symbol is used to connect parts of a flowchart that are on different pages. It indicates the continuation of the flow on another page.
10) Data Flow: Data flow diagrams may be included to illustrate the movement of data between processes, data stores, and external entities.
11) Terminators: Terminators, often represented by ovals, show the start and end points of a process. They are used to indicate where the process begins and where it concludes.
12) Annotation: Additional explanatory notes or annotations can be added to provide more context or details about specific steps in the flowchart.
We frequently use pie charts in our daily lives, aiding us in understanding data effectively. But do you also incorporate bar graphs in your presentations? If your answer is no, we have a fantastic suggestion for you!
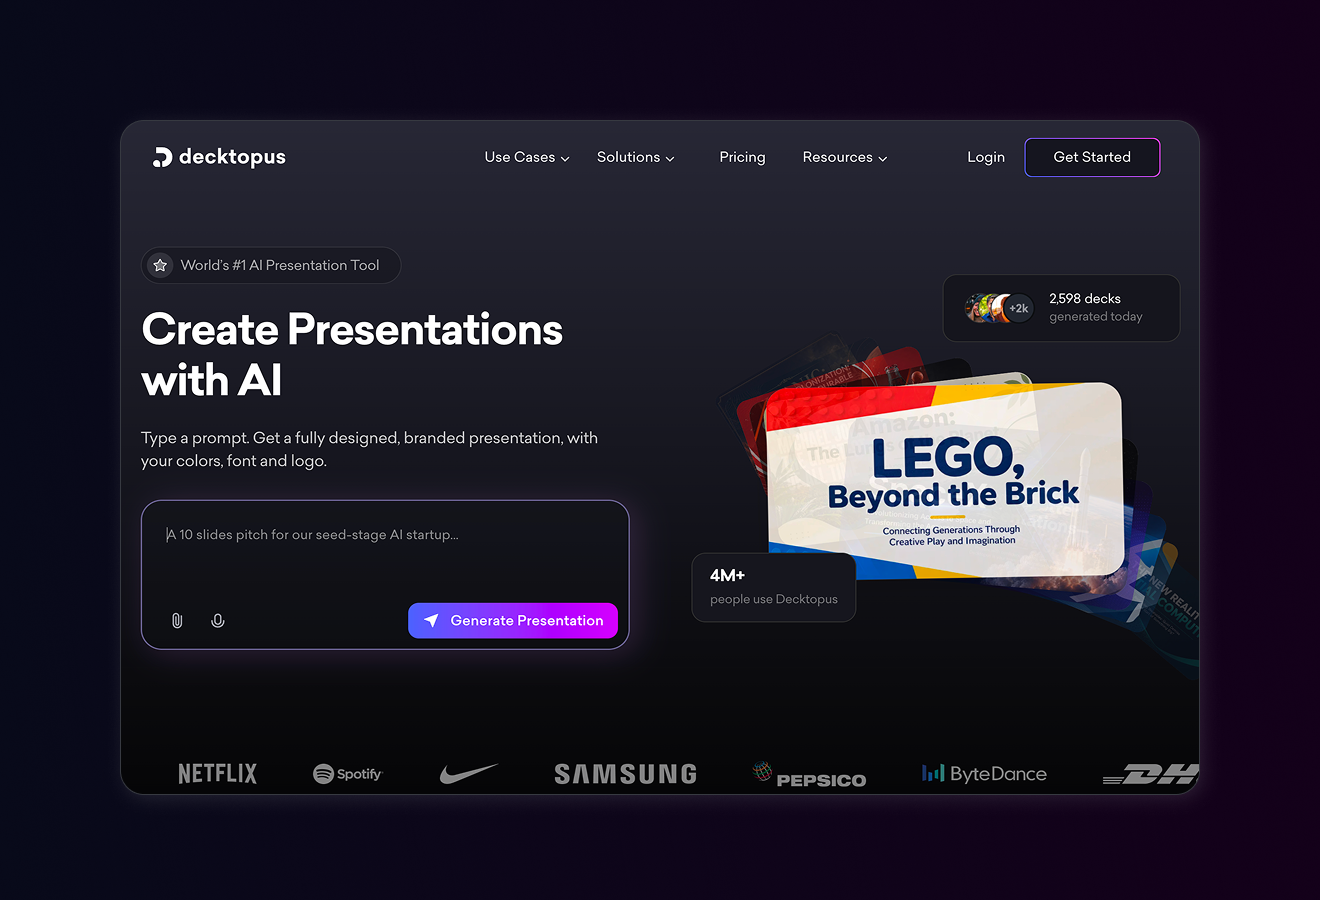
Flowcharts work best when they're paired with clear communication of the process they represent. If you're building a presentation that explains a workflow or process, Decktopus generates a full deck from your description. Visuals, structure, and on-brand styling are handled automatically, so you can focus on the message instead of the design.
Step By Step Guide On Creating A Flow Chart

Step 1: Define the Purpose and Scope
- Clearly understand the purpose of the flowchart.
- Identify the specific process or system you want to represent.
- Define the boundaries of the process.
Step 2: Identify the Key Steps
- List the major steps or actions involved in the process.
- Break down the process into smaller, manageable tasks.
Step 3: Determine the Flow of the Process
- Identify the sequence in which the steps occur.
- Determine decision points where the flow can diverge based on conditions.
Step 4: Choose Flowchart Symbols
- Select appropriate symbols for each type of step or action.
- Common symbols include rectangles for processes, diamonds for decisions, ovals for start/end points, and arrows for flow direction.
Step 5: Use Standard Flowchart Symbols
- Adhere to standard symbols and conventions to ensure clarity and consistency.
- Follow a recognized flowcharting standard like ANSI, ISO, or BPMN if applicable.
Step 6: Start with the Terminator
- Begin the flowchart with a start or end point, often represented by an oval shape.
Step 7: Add Process Steps
- Use rectangles to represent processes or tasks.
- Label each rectangle with a concise description of the task.
Step 8: Include Decision Points
- Use diamonds to represent decision points.
- Label each diamond with the decision to be made.
Step 9: Connect Steps with Arrows
- Use arrows to connect the flowchart symbols and show the direction of flow.
- Ensure that the arrows follow the logical sequence of the process.
Step 10: Include Connectors
- Use connectors to indicate where a flowchart continues on another page.
- Ensure that the connectors link to the corresponding symbol on the next page.
Step 11: Review and Refine
- Review the flowchart for clarity, accuracy, and completeness.
- Ensure that the flowchart accurately reflects the intended process.
Step 12: Finalize the Flowchart
- Make any necessary adjustments based on feedback.
- Finalize the flowchart, ensuring that it is easy to understand and follows a logical sequence.
Step 13: Share and Communicate
- Share the flowchart with relevant stakeholders.
- Use the flowchart as a communication tool for training, analysis, or process improvement.
Step 14: Keep it Updated
- Update the flowchart as the process evolves or changes over time.
- Ensure that the flowchart remains an accurate representation of the current process.
Once your flowchart is ready, you'll often want to present it. Decktopus turns your process explanation into a polished, on-brand deck in minutes. Describe your topic, paste your homepage URL, and your presentation is ready to share.
How to Create a Flow Chart Slide in Decktopus
If you want your flowchart inside a presentation that's ready to share or present, Decktopus generates it for you as part of your full deck. Here's how:
1. Describe your topic.
Type what your presentation is about and include the process you want to visualize. For example: "A presentation about our customer onboarding workflow, including a flow chart that shows each step from signup to first purchase."
You can also upload supporting files like a process document, brief, or notes to give Decktopus more context.

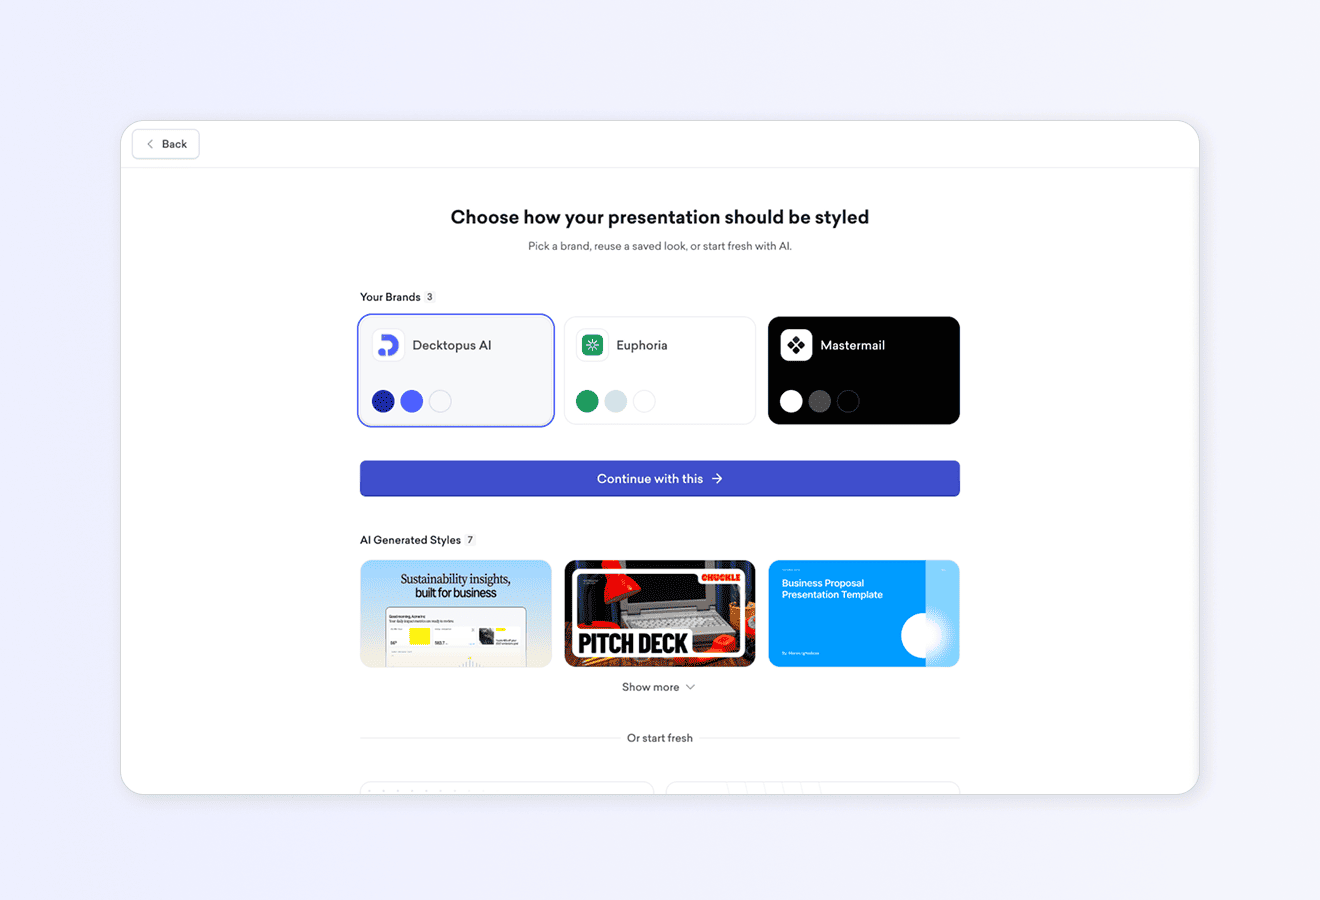
2. Choose your style.
Paste your website URL to auto-import your logo, colors, and fonts. Or apply a saved Brand Kit. Or let AI generate a style from scratch.
3. Review the outline.
Decktopus generates a slide structure based on your topic. You'll see where the flow chart slide fits, along with supporting slides like the process overview, decision points, and outcomes. Adjust the structure or order before the full deck is built.
4. Refine in the editor.
Once your deck is ready, use the prompt bar to fine-tune the flow chart. Try instructions like:
- "Add a decision point after step 2."
- "Change the flow chart to show 5 steps instead of 4."
- "Make the chart vertical instead of horizontal."
- "Highlight the final step."
Brand Compliance auto-checks every slide so your colors, fonts, and logo stay consistent.

5. Export or share.
Download your presentation as PDF or PPT, share via link, or present directly from the editor.
The advantage: your flowchart isn't a one-off visual. It lives inside a complete, on-brand presentation that's ready to send to stakeholders, embed in a meeting, or use in training.

Frequently Asked Questions
1) Is there a flow chart template in Excel?
Select TEMPLATES. Select Flowchart. Select Basic Flowchart - Data Visualizer, Cross-Functional Flowchart - Data Visualizer, or Audit Diagram - Data Visualizer. A Data Visualizer template has an Excel icon in the top left corner.
2) How do I make my own flowchart?
Define Purpose: Identify the process you want to represent.
List Steps: Identify key steps and decision points.
Choose Symbols: Select symbols for processes, decisions, etc.
Start with Terminator: Begin with a start/end point.
Add Steps: Use rectangles for processes, diamonds for decisions.
Connect with Arrows: Use arrows to show the flow.
Review and Refine: Ensure clarity and accuracy.
Finalize: Make adjustments, finalize the flowchart.
Share and Update: Share with stakeholders and update as needed.


.avif)


.svg)
.svg)
.svg)
.svg)
.svg)
.svg)
.svg)
