
.svg)
.svg)
.svg)


.svg)


What is a Line Graph?
A line graph is a visual representation of data that illustrates the relationship between two variables over a continuous interval. It typically uses lines to connect individual data points, helping to show trends, patterns, or fluctuations in the dataset.
The x-axis represents the independent variable, while the y-axis represents the dependent variable. Line graphs are commonly used in various fields to present data in a clear and easily interpretable format.
Where are Line Graph Makers Used?
- Business and Financial Analysis
- Scientific Research and Experiments
- Educational Presentations
- Market Trends and Analysis
- Performance Metrics Tracking
Navigate to Decktopus's comprehensive line graph guide to unlock a wealth of knowledge, discover best practices, and empower yourself with the expertise needed to effectively communicate complex data trends.
Your journey towards becoming a proficient line graph creator starts here don't miss out on this invaluable opportunity to enhance your skills. Click here to your learning adventure now!
Best Line Graph Generator: TOP 10 Line Graph Makers
1. Decktopus: The Best Line Graph Creator

- Smart Templates: Access a variety of templates designed to streamline line graph creation.
- User-Friendly Interface: The platform offers a highly intuitive interface suitable for users at all skill levels.
- Collaborative Tools: Enhance teamwork with collaborative tools, ensuring real-time cooperation on your line graph projects.
- Seamless Integration: Integrate smoothly with various platforms and tools for enhanced workflow efficiency.
- Versatility: Beyond line graphs, Decktopus supports the creation of various visual assets, presentations, and more.
- Mobile Limitations: Like many design platforms, Decktopus may be more comfortable to use on desktop than on mobile devices.
- Learning Period: While user-friendly, some time may be needed to explore and master all of Decktopus' features.
- BUSINESS AI: $36.99/user/month
- PRO AI: $9.99/month
Embark on your journey to becoming a proficient line graph creator with Decktopus. Don't miss out on the opportunity to enhance your data visualization skills. Click here to start your learning adventure now!
2. GitMind:
- Features: Free, online mind map and flowchart maker with line graph generator.
- Advantages: Free templates, easy sharing via URL, online collaboration for multiple editors.
3. Canva:
- Features: Online infographic maker, creative line chart maker with templates and cliparts.
- Advantages: Creative elements, available online for free with subscription options.
4. RapidTables:
- Features: Online table and chart generator, automatic line graph creation.
- Advantages: Free to use, produces line, bar, and pie charts effortlessly.
5. ChartGo:
- Features: Online tool for line, pie, area, and bar charts.
- Advantages: Free to use, easy navigation with a clean interface, exports in Excel and CSV.
6. Meta-Chart:
- Features: Online line graph maker with chart design options.
- Advantages: Customizable appearance, free to use from almost every web browser.
7. Plotvar:
- Features: Online application specializing in line graphs with a 4-step creation process.
- Advantages: Claims to be the easiest graph maker online, straightforward and efficient.
8. Venngage:
- Features: Infographic tool with professional line graph making capabilities.
- Advantages: Wide range of chart-making options, premium graphics for visually appealing charts.
9. Visme:
- Features: Online app for making line graphs with provided templates.
- Advantages: Neat and organized editing panel, free and premium subscription options.
10. OnlineChartTool:
- Features: Online chart and graph creator with a straightforward approach.
- Advantages: Free to use, simple and easy to navigate, provides editable sample templates.
How to Create a Line Graph with Decktopus?
Step 1
Open Decktopus AI
Click on the Decktopus website. You can easily create an account or log in!

Step 2
Create a Slide
On the dashboard, choose what you want to do. If you want to create a slide, click on “Create with AI” to create slides powered by AI. After, you can create your own line graphs on the AI-created slide.
Another option is to click on “Start from Scratch.” This option will provide you with different templates to choose from. You can make adjustments to the template and create a line graph compatible with the template aesthetic.
Step 3
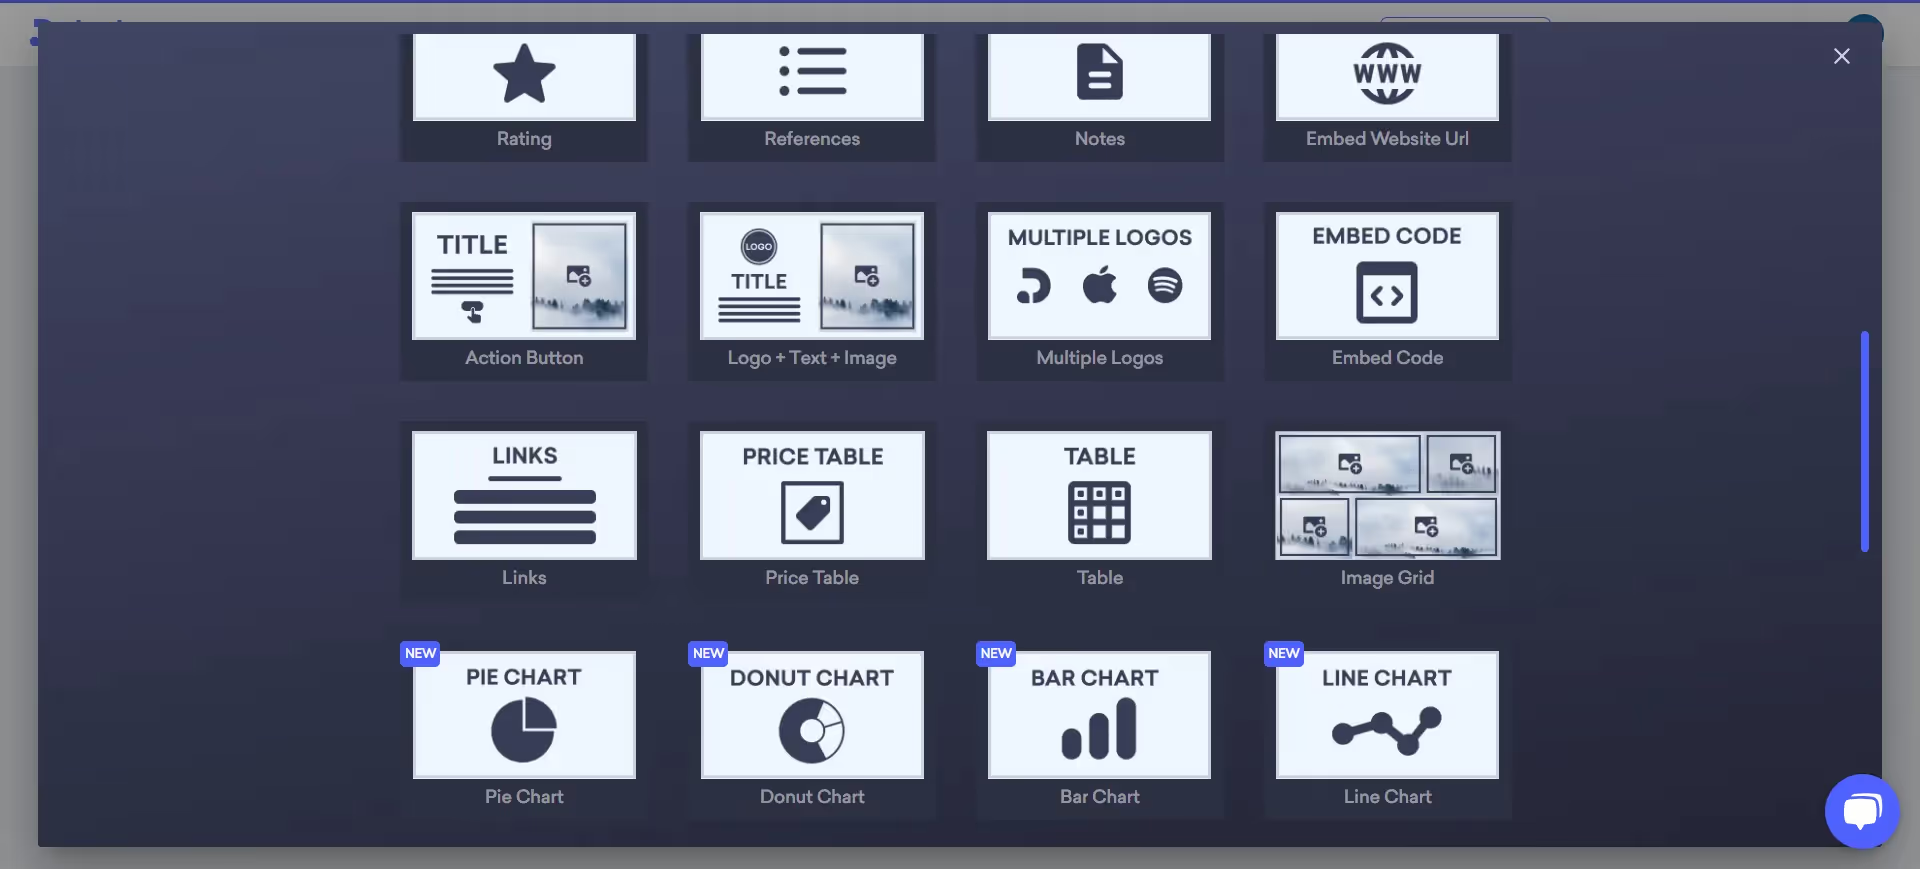
Choose the Line Graph Template
Click on the “add a slide” button at the bottom. From the list of different templates, choose the line chart template.
Step 4
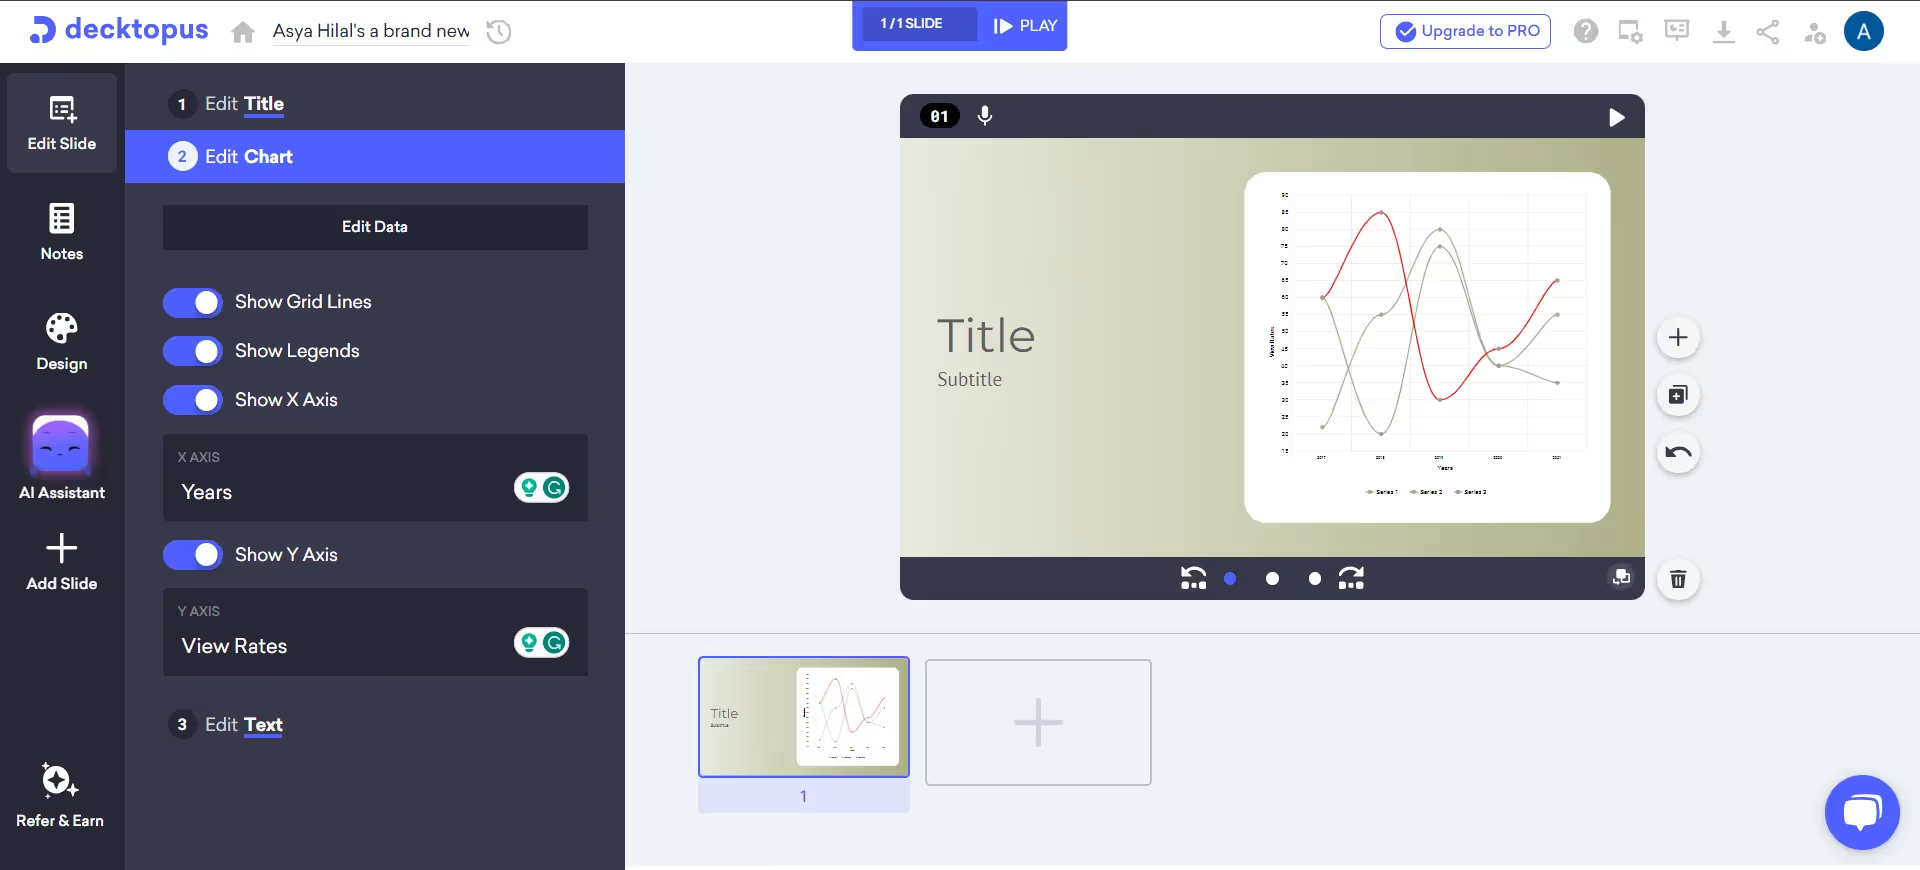
Enter Your Data
If you click on the line graph, it will provide a table for you. Enter your data manually or copy/paste from your Excel or datasheet. Adjust your input for an accurate line diagram. You can add or subtract additional rows/ columns on the table by right-clicking on them.

Step 5
Customize Your Line Graph
By this step, your line graph should be created. Now, it is time to beautify it!
- Adding labels: By clicking on the x-axis and y-axis, you can make the labels shown. You can customize the data labels and give meaning to your graph.
- Adding title: Click on the “Edit title” to add a title for your graph. This will give meaning to your table and will make it easier to understand.
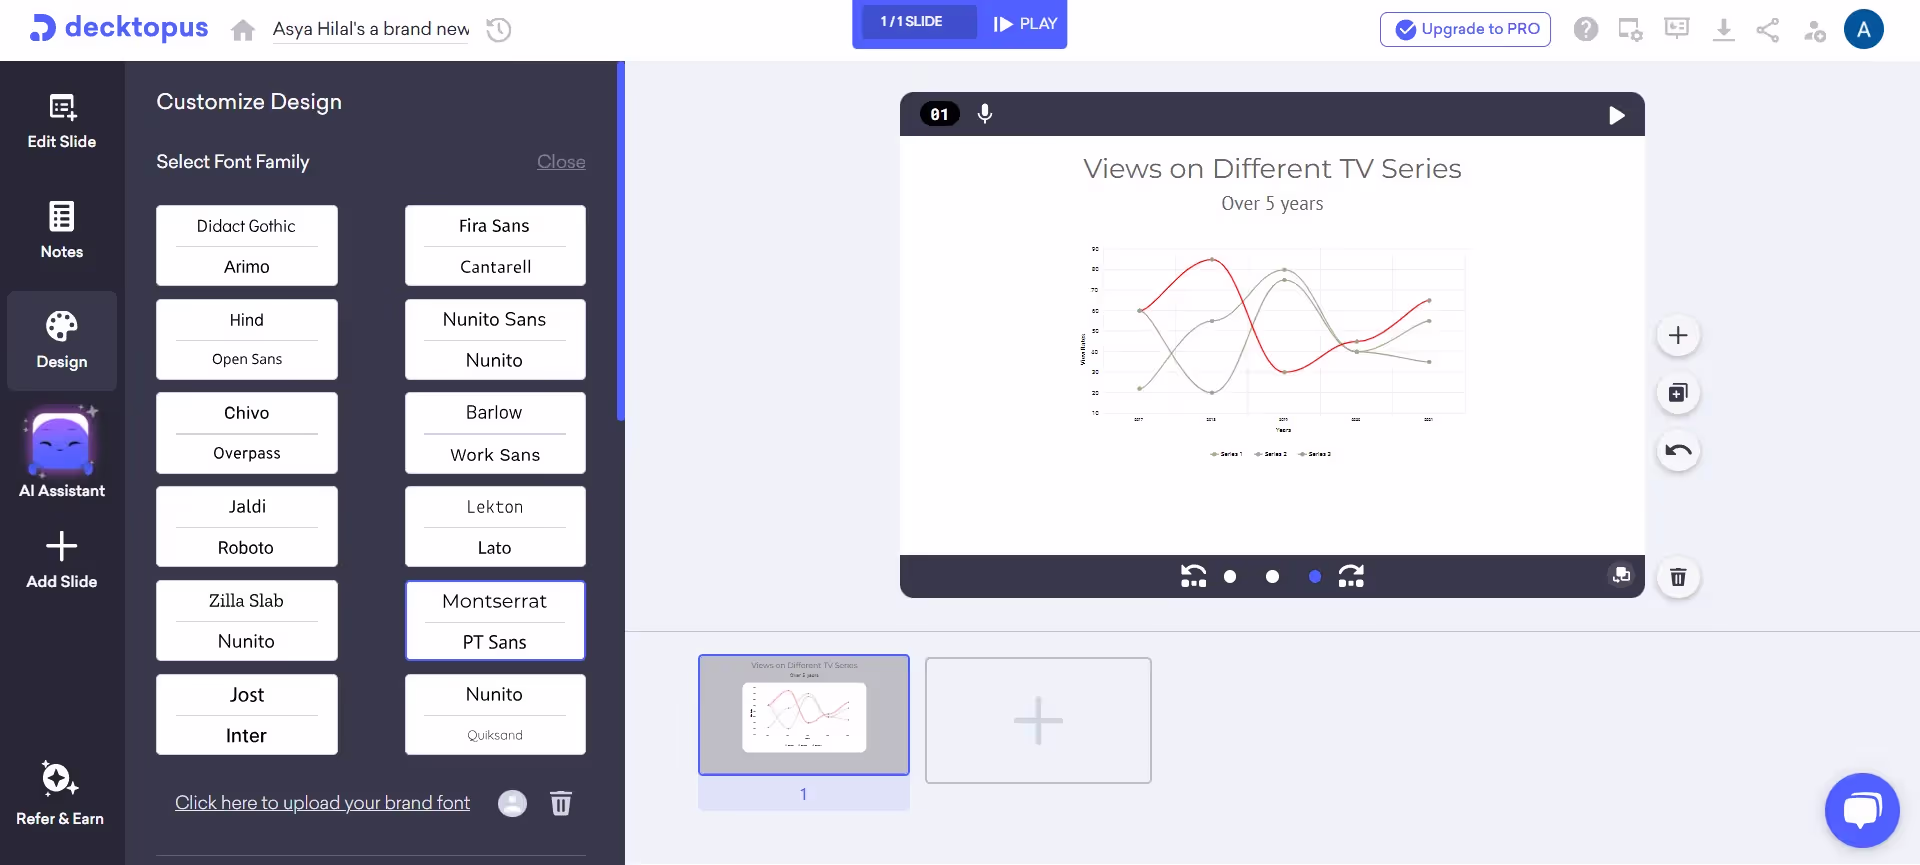
- Adjusting colors: Click on the “Design” tab. You can change the colors of the graph. There are different color palettes that are aesthetically pleasing. However, you can also create your own color palette by clicking on the “Edit colors” option. The possibilities are limitless!
- Changing the font: You can also change the font of your graph. Click on the “Design” tab and edit your font. You can choose one of Decktopus’s fonts, or you can add your brand's font!
- Deducting data: You can deduct a line or variable on the line graph as well. To make a data disappear, click on its name in the legend. This will make it invisible to others.
Step 6
Export the Table
You can download your Decktopus slide as a PDF or PPT. You can also continue editing on Decktopus and present your slide on our interface!
- Decktopus has a presentation mode and a rehearsal mode.
That’s it!
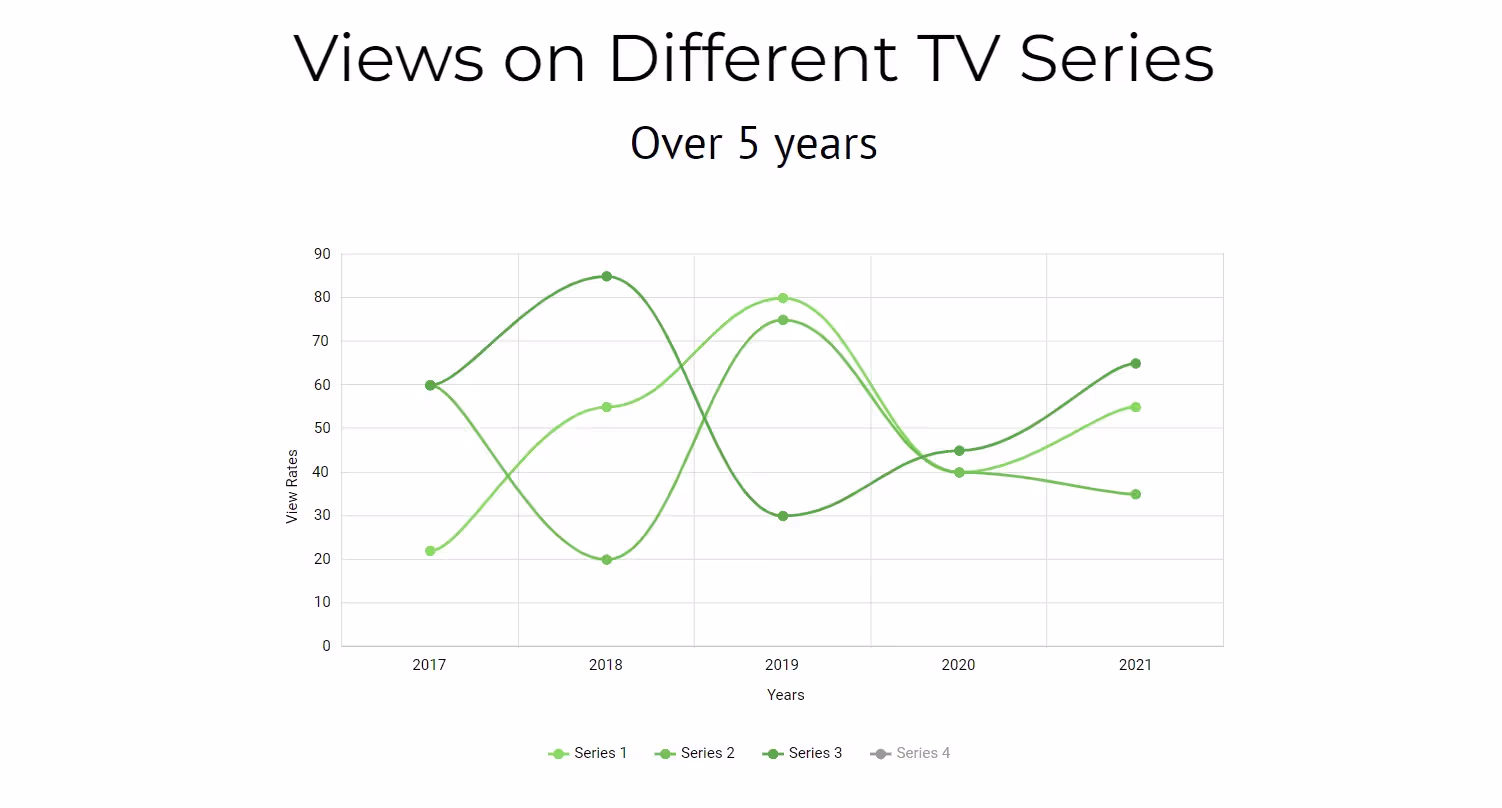
Here are some line graph examples on Decktopus:
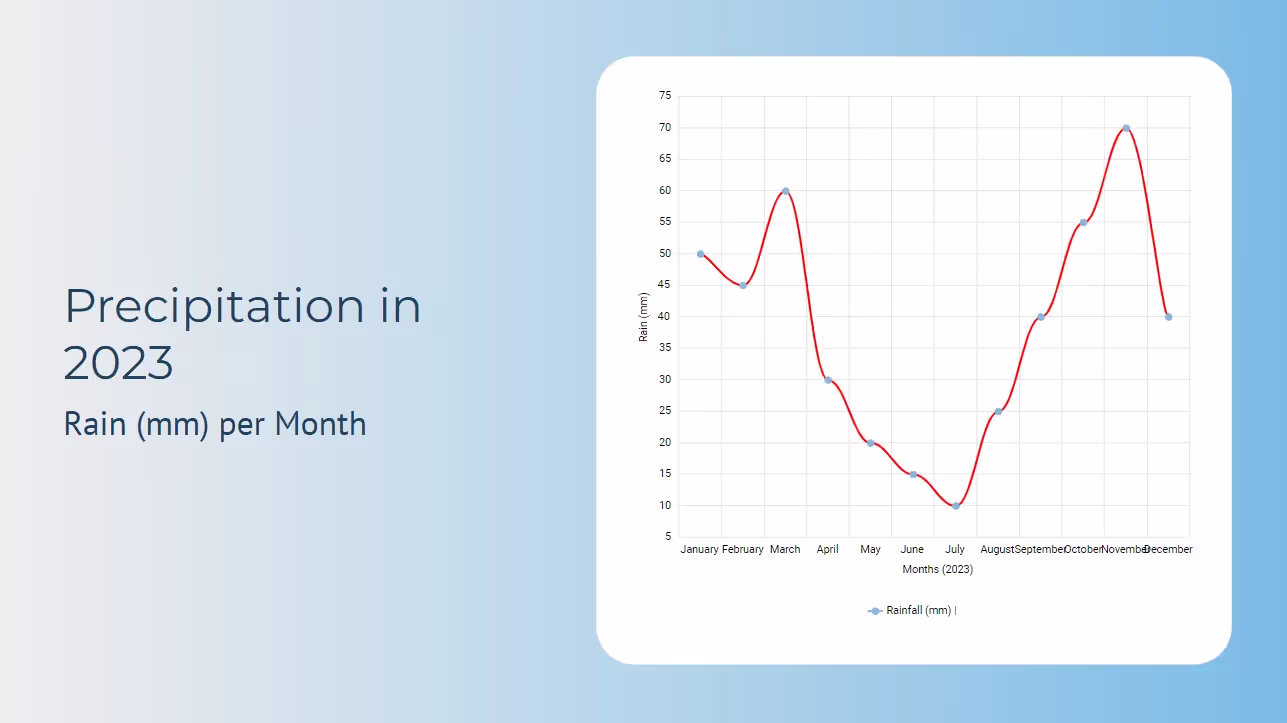
- This line graph represents the total precipitation in 2023. As you can see, the x-axis represents the months, and the y-axis represents the rainfall (mm).
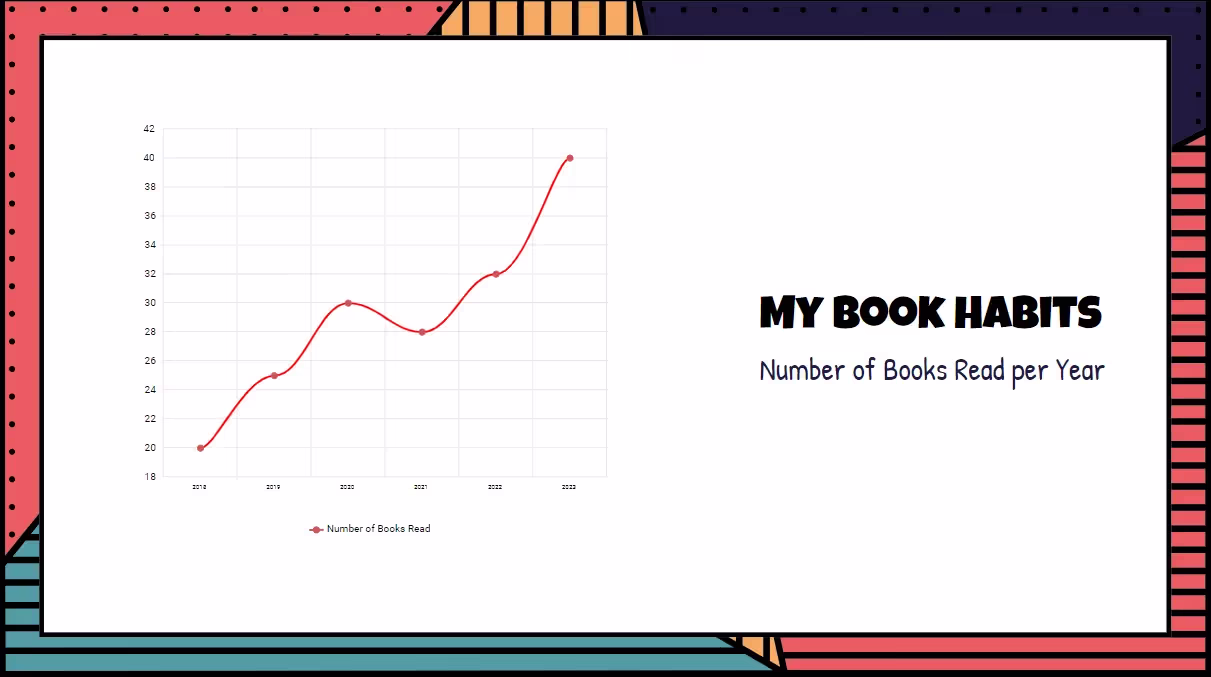
- Our second example is a graph for the total number of books read per year. Here is the data table:
You can create your own line graph as well with this data!
Try to import different data sets on Decktopus! Decktopus is an easy-to-use data visualization tool. Try it for yourself and experience the Decktopus for FREE.
Frequently Asked Questions
1. Where line graphs are used?
Line graphs are everywhere in our lives. Line graphs can be encountered from the stock market to the IELTS test. It is important to understand how line graphs are created to interpret line graphs afterward.
Decktopus has an easy-to-understand interface for line graphs! You can create and tweak your created line graph with ease!
2. Where can I create line graphs?
There are many line graph generators. You can create line graphs in R or in Excel. However, our recommendation is Decktopus! Decktopus allows you to create beautiful line graphs with AI.
3. What is the difference between a line graph and a bar graph?
When a line graph vs. bar graph comparison is made, it should be understood that these graphs are visualizations for data.
This means they may look different, but both of them represent data points and the connection between them. While line graphs are made by connecting the data points as a line to show trends or changes over time, bar graphs have rectangles that represent different categories in data.
The quantity of the data can be interpreted from the length of the bars.
.avif)

.avif)


.svg)
.svg)
.svg)
.svg)
.svg)
.svg)
.svg)
