Business & Strategy
Putler - The Ultimate Tool to Analyze Your Business Data
In this article, I will shed light on one such tool that will help pull in all your data in one place. It will also help you monitor and make smart data driven decisions on your own. Interested? Keep reading.

Data is powerful. It helps you spot opportunities, trends and early red flags. But businesses often struggle as their data is scattered. They either need to depend on multiple people like accountants/consultants and get their data sorted. Or they commit the mistake of overlooking their data and making all decisions based on their gut.
Either way, they end up wasting time as well as energy and ultimating failing.
Now what if you could end this misery?
In this article, I will shed light on one such tool that will help pull in all your data in one place. It will also help you monitor and make smart data driven decisions on your own.
Interested? Keep reading.
Say Hello to Putler
Putler, is a multichannel business analytics software. It aggregates data from multiple places and provides you with a big picture of your entire business.Putler provides you with in-depth reports on Products, Customers, Orders and your Website Traffic. Additionally, it also provides you with growth insights, forecasts, goal tracking, segmentation and a lot more.
Let’s dive into the most important features of Putler one by one.
Unify and analyze all your data from a single place
Connect all your multiple payment gateways, multiple stores, multiple Google Analytics into Putler.
Once you have connected all your data sources, Putler will consolidate all the data, remove duplicates and show you enriched reports on Products, Customers, Orders, Subscriptions and Website Audience.
Explore all the 17+ integrations that Putler connects with
Monitor key business metrics and gain insights from detailed reports

Putler has a dedicated dashboard for everything!
Be it - Products, Customers, Orders, Subscriptions, Website Audience.
NOTE: Since Putler caters to both SaaS as well as eCommerce businesses (Non SaaS), it provides metrics that are needed for analyzing both types of business models.
Some key metrics that Putler provides is as follows-
- Current month’s sales
- Balances
- Sales trends for the last 3 months.
- New vs returning customers
- Refund, Disputes
- SaaS KPIs - MRR, Churn, ARR, ARPU, LTV
One thing I mentioned above was insights.
They are super useful and help you get more out of your data.
Putler makes gaining insights very easy. Unlike other reporting tools, it provides you both reports as well as insights.
Putler gives you one new insight every day.It also analyzes your store's performance during the Holiday Season and gives you insights like which was the better performing holiday? Which products were trending? What was your sales average? etc.
Some examples of key insights that Putler provides are as follows:
- Products that are frequently bought together
- Sales heatmap
- Refund rate
- Pricing sweet pot
- Holiday Season insights
And a lot more.
Take a look at the live demo here.
Multi-store reporting

If you have multiple websites/multiple stores/ multiple Amazon shops/ shopify shops etc. Then you have to give Putler a try.
Once you connect all your stores within Putler, you can then view both consolidated reports from all your stores or create separate views for each store and view reports for each store individually.
Whatever you choose, both ways you save a ton of time. You don’t need to juggle between different tools or remember a hundred log-in details. Maintaining security across all these access points is much simpler when using a robust Keeper alternative to manage your business credentials.
Unlimited segmentation - Products, Customers, Orders

Putler allows you to filter and segment your data in multiple ways.
It has well thought of filters on every dashboard. Plus, if you wish to create a custom segment, you can create it and save it for future use as well.
Some examples of filters provided by Putler:
1. Location
2. Order status
3. Customer type
4. Customer since
5. Revenue contribution and a lot more.
RFM Customer Segmentation
Along with dashboard specific filters, Putler also provides RFM segmentation. That is a technique of segmenting your customers based on their past shopping behavior. Putler divides your customers into 11 categories based on 3 things:
1. How recently a customer has bought from you?
2. How frequently does that customer purchase from you?
3. What monetary value does he contribute to your business?
Based on all the 3 parameters, Putler then divides customers into 11 segments (as shown in the image). You can then export these segments to send out targeted emails and increase email conversions.

Everyone on your team can benefit from Putler
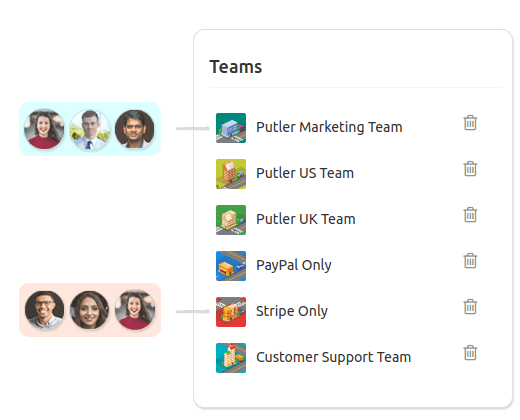
Putler can be used by your entire team.
- Top level managers can use it every day to find out about the health of the business.
- The marketing team can use it to spot trends, create laser-targeted segments, understand customers and a lot more.
- The customer support team can use it to provide refunds, check customer purchase history, find customers, verify payments etc.
- Accountants can use it to tally sales.
Pricing
Putler has metered billing that’s based on revenue. Meaning it charges you based on your last 30 days revenue. So if your revenue falls/rises, your plan will also change automatically.Putler lowest plan starts from $20/month.
Take a look at the various pricing slabs here.
Practical ways you can use Putler
Having Putler is like having total control of your business data. You won’t have to rely on some third party or your subordinate for data related insights.
Using Putler you can instantly;
Understand the pulse of your business.
Make more data driven decisions with confidence.
Identify product trends.
Spot red flags and take proactive steps to minimize them.
Check for opportunities and grab them.
Monitor all your data quickly.
Understand your customers.
Gather numbers for your board presentation/meetings.
That’s all folks!
Putler is a simple analytics and insight tool. It is easy to get started with and provides a ton of reports and marketing insights. So do give Putler a try.
They have a 14 day FREE trial. You don’t have to know to code or add in your credit card details during the trial, so it is completely secure and a total win-win.
Go sign up for Putler today!

Decktopus Content Team
Related posts

4 Great Ways to Increase Your Customer Base
Attracting customers is hard. For many companies, getting enough traffic to their offers consistently is an uphill battle, which is one of the main reasons why 50% of businesses fail within the first five years.
Business & Strategy

5 Ways To Make Board Meetings More Valuable
Board meetings are evolving. Gone are the days when these meetings only revolved around Sales. Today, board meetings consist of a 360 view of the organization. They focus on the holistic performance of the company.
Business & Strategy

Revolutionize Education with Best AI Tools for Students: Uncover the Best AI Education Tools For Education
Unleash the power of artificial intelligence with AI tools in September. Discover how AI tools can enhance student experiences. Explore ClickUp's AI features for streamlined productivity.
Business & Strategy