
.svg)
.svg)
.svg)


.svg)


.png)

.avif)

Decktopus Content Team
October is where everything collides.
Marketers, sales teams, and business leaders all hit the same wall: end-of-quarter reporting, fourth-quarter planning, and early holiday prep—all while fighting tighter deadlines and creeping burnout. It’s the ultimate corporate crunch month.
For marketers, it’s about making sense of Q3’s chaos and getting Q4 campaigns aligned before CPCs spike. Sales teams are under pressure to clean stale pipelines and forecast fast. Business leaders? They’re juggling board updates, budget reforecasts, and annual strategy kickoffs. Everyone’s calendar is full, but the slide decks keep stacking up.
This guide exists to simplify the madness.
You’ll get a complete breakdown of the exact presentations you need to create this month, across departments. For each, we’ll show:
- What the deck is for
- The slides it should include
- AI prompts to generate those slides instantly
- Zapier automations to keep them updated with live data
And the best part? You don’t need to start from scratch. With Decktopus AI, you can generate slide-ready decks in minutes. Add Zapier into the mix, and your decks can stay synced with tools like Google Ads, GA4, Salesforce, or your budget spreadsheet—all without manual updates.
Let’s get into it.
October Presentations for Marketers
Marketing in Q4 is high-stakes. It’s not just about launching new campaigns—you’re also wrapping the year’s biggest quarter and prepping for the most competitive ad season.
Here are three decks every marketing team needs this month, complete with slide breakdowns, AI prompt ideas, and time-saving automation tips.
Q3 Performance Recap Presentation
Use Case
Wrap up Q3 results, demonstrate ROI, and extract key learnings to shape Q4 strategy. Great for internal team syncs or leadership updates.
Slide Breakdown
- Executive KPI Summary
- Top Campaign Highlights
- Key Learnings + Takeaways
- Recommendations for Q4
AI Slide Prompts
Create a Q4 Marketing Plan deck designed to align the marketing team and leadership around upcoming campaigns, content strategy, and goals for the quarter (October–December).
The deck should include the following slides:
- Campaign Calendar (Oct–Dec):
Build a visual calendar with key campaign launches, events, and promotions. Include campaign names, target audiences, and dates. Color-code by theme (e.g., brand awareness, holiday push). - Content Pillars & Channels:
List 3–5 primary content themes for Q4. For each pillar, show which channels will be used (e.g., blog, email, paid social, influencers). Use icons or a grid layout for clarity. - Budget Allocation Overview:
Display a budget breakdown across paid media, organic content, partnerships, and tools. Use a pie chart or bar graph. Include percentage allocations and any notable changes from Q3. - Quarterly KPIs & Benchmarks:
Present target KPIs for Q4 (traffic, conversions, ROI, engagement). Show past performance (from Q3) as a benchmark for comparison. Use visuals like side-by-side bars or trend lines.
Design Style:
Use a modern, visual-first layout. Include icons, light visuals, and brand colors. Keep text concise and high-impact.
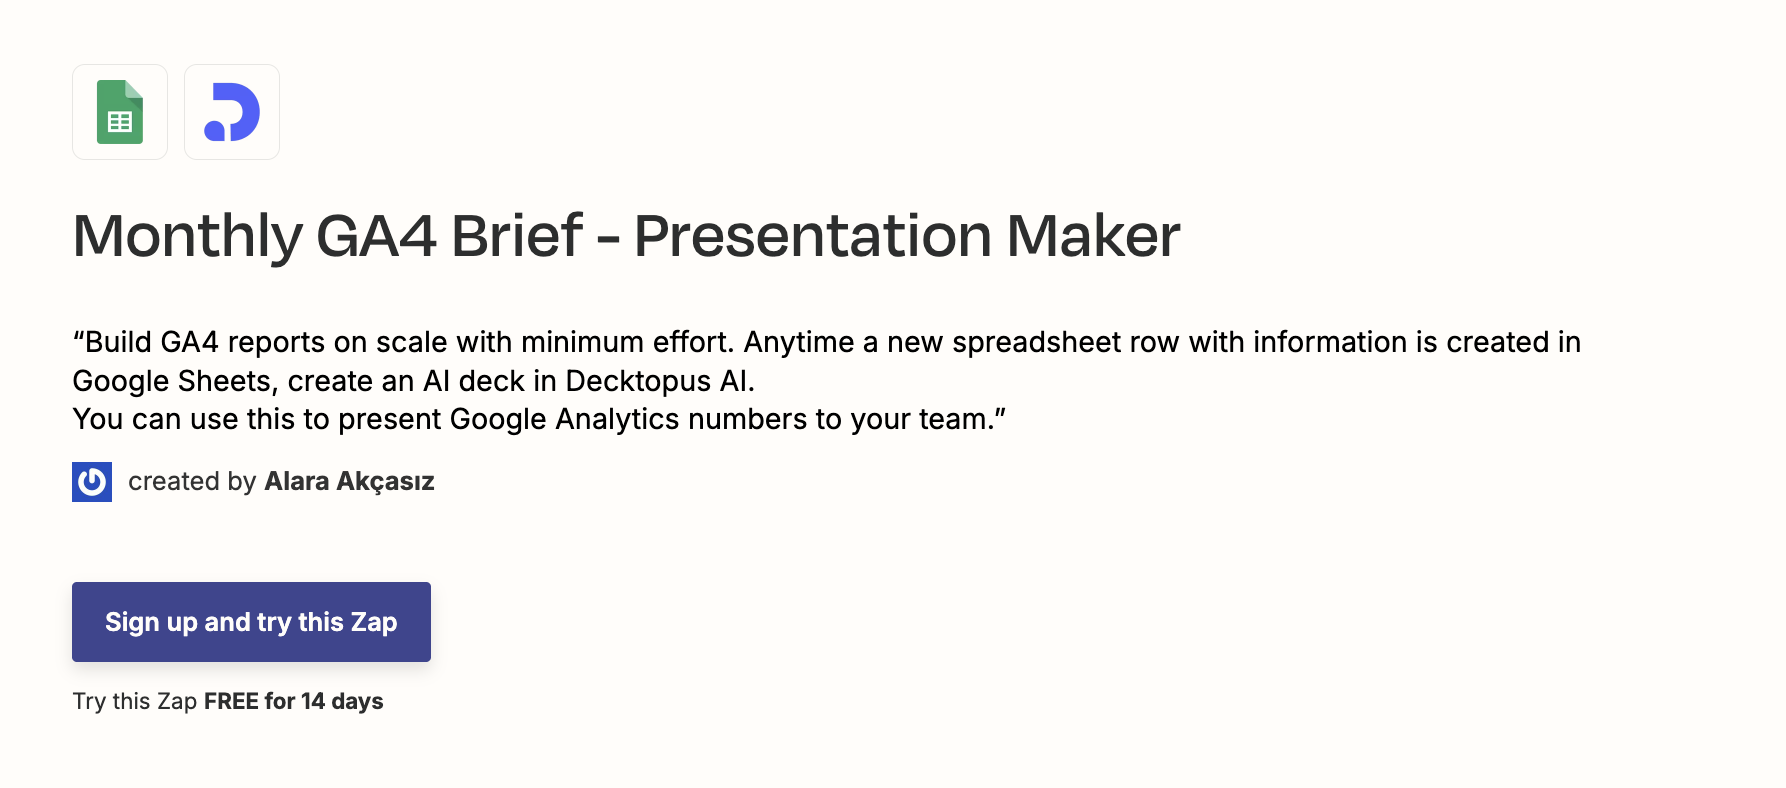
Time-Saver with Zapier ⚡
Connect Google Analytics 4 or Google Ads to Decktopus via Zapier. Set it to pull live performance data into slides weekly. No more manual number crunching before every meeting.
Q4 Marketing Plan Presentation
Use Case
Align your team (and leadership) around what’s coming next: campaigns, budgets, content themes, and KPIs for the quarter.
Slide Breakdown
- Campaign Calendar (Oct–Dec)
- Content Pillars + Channels
- Budget Allocation Overview
- Quarterly KPIs + Benchmarks
AI Slide Prompt
Create a Q4 Marketing Plan deck designed to align the marketing team and leadership around upcoming campaigns, content strategy, and goals for the quarter (October–December).
The deck should include the following slides:
- Campaign Calendar (Oct–Dec):
Build a visual calendar with key campaign launches, events, and promotions. Include campaign names, target audiences, and dates. Color-code by theme (e.g., brand awareness, holiday push). - Content Pillars & Channels:
List 3–5 primary content themes for Q4. For each pillar, show which channels will be used (e.g., blog, email, paid social, influencers). Use icons or a grid layout for clarity. - Budget Allocation Overview:
Display a budget breakdown across paid media, organic content, partnerships, and tools. Use a pie chart or bar graph. Include percentage allocations and any notable changes from Q3. - Quarterly KPIs & Benchmarks:
Present target KPIs for Q4 (traffic, conversions, ROI, engagement). Show past performance (from Q3) as a benchmark for comparison. Use visuals like side-by-side bars or trend lines.
Design Style:
Use a modern, visual-first layout. Include icons, light visuals, and brand colors. Keep text concise and high-impact.
Data Integration (via Zapier):
Pull budget data from spreadsheets and campaign dates from Asana/Trello if connected, to auto-fill calendar and budget slides.
Holiday Campaign Pitch Deck
Use Case
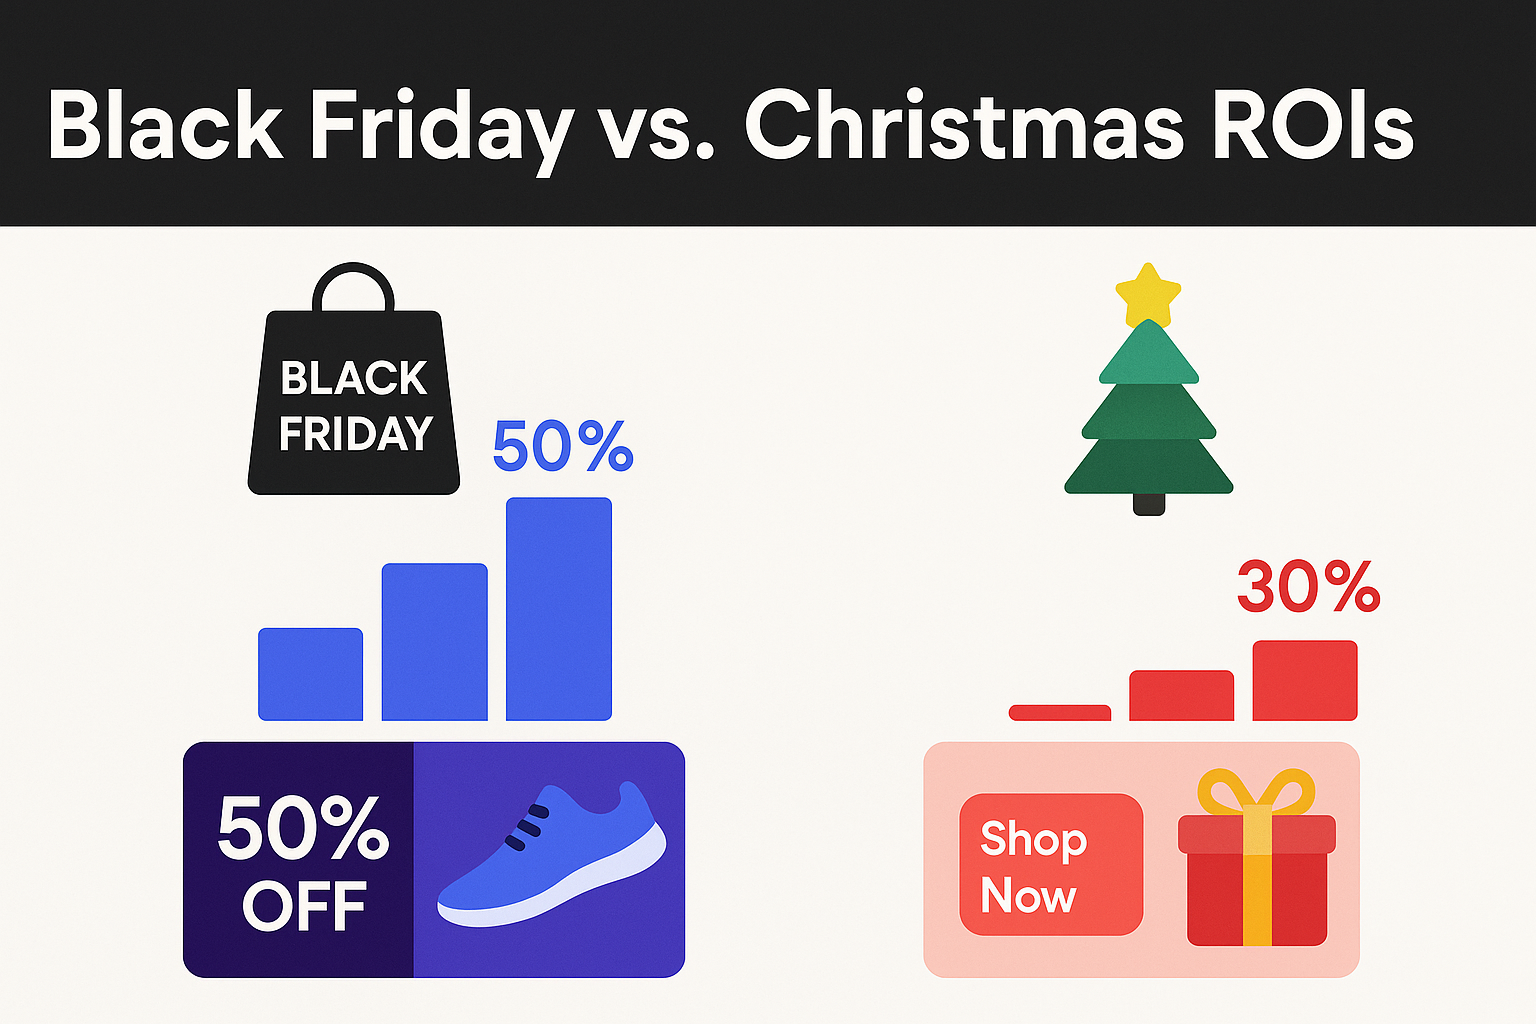
Present your Black Friday and holiday campaign ideas early—before CPCs spike and everyone’s booked. Pitch creative, budget, and expected ROI.
Slide Breakdown
- Campaign Hook / Offer Strategy
- Concept Visuals (mock ads or moodboards)
- Timeline (launch, test, optimize)
- Projected ROI / Budget Needs
AI Slide Prompts
Create a Holiday Campaign Pitch deck to present Black Friday and end-of-year marketing campaign ideas to internal stakeholders. The goal is to align on creative direction, budget, and projected ROI ahead of the seasonal ad spike.
Structure the deck with the following slides:
- Campaign Hook / Offer Strategy:
Write a compelling headline and subheading for the holiday campaign. Highlight the value proposition and urgency (e.g., “Limited-time 40% Off” or “Free gift with early access”). Tailor messaging to the primary audience (e.g., B2B SaaS buyers, ecommerce shoppers). - Concept Visuals (Mock Ads or Moodboards):
Include draft ad visuals or creative inspiration for how the campaign will look across key channels (Instagram, email, homepage banner). Use moodboard style or mockups. Include copy snippets or taglines. - Timeline (Launch, Test, Optimize):
Show a visual timeline of key dates: creative finalization, A/B test launch, full rollout, optimization windows, and cutoffs. Highlight important deadlines. - Projected ROI / Budget Needs:
Use charts or a table to estimate campaign spend, CPCs, expected conversions, and ROI. Include comparisons to last year’s performance if available. List budget required and justification.
Design Style:
Use a festive but clean design—winter/holiday accents with professional layout. Use icons, graphs, and bold callouts. Prioritize clarity, especially in budget and ROI slides.
Optional Automation via Zapier:
If connected, auto-fill ROI data from last year’s performance (e.g., from GA4 or Google Ads). Connect to a media plan spreadsheet for real-time budget updates.
These three decks don’t just help marketers stay on top of October—they turn them into proactive leaders. When you’re not scrambling to build slides, you’re free to focus on higher-level creative, messaging, and performance.
With Decktopus AI and a few smart Zapier zaps, you can cut hours of deck-building down to a few minutes—and walk into every meeting looking 10 steps ahead.
October Decks for Sales Teams
Sales teams are deep in the Q4 push. It’s the last chance to meet annual targets, clear stalled deals, and take advantage of seasonal demand. But that also means constant status updates, forecasts, and enablement content — all of which usually live in decks.
Here are the three must-have presentations every sales org should build this month — fast.
Pipeline Review Deck
Use Case
Keep your pipeline clean and focused. Use this deck in weekly or biweekly sales syncs to spot red flags, identify top opportunities, and realign rep attention where it counts.
Slide Breakdown
- Current Pipeline Overview
- Stalled Deals & Inactivity
- High-Priority Deals to Watch
- Rep-by-Rep Breakdown (optional)
AI Slide Prompts
Create a Sales Pipeline Review deck to be used in weekly or biweekly sales team syncs. The goal is to give visibility into pipeline health, highlight priorities, and guide rep focus.
Include the following slides:
- Current Pipeline Overview:
Display total pipeline value, number of open deals, average deal size, and stage distribution. Use a funnel graphic or bar chart. Highlight changes from the previous review. - Stalled Deals & Inactivity:
List top 5–10 deals with no activity in the last 14+ days. Include deal size, stage, and assigned rep. Use visual cues (e.g., warning icons) to indicate inactivity risk. - High-Priority Deals to Watch:
Highlight deals with a high close probability (>50%), strategic importance, or end-of-quarter urgency. Include client name, expected close date, and next step. - Rep-by-Rep Breakdown (Optional):
Show pipeline by rep with deal count, total value, and activity level. Use bar or column charts for quick comparison.
Design Style:
Professional and data-focused layout. Use CRM-style icons (e.g., funnel, dollar sign, checkmarks). Prioritize visual clarity for numbers and statuses.
Automation Tip with Zapier:
Pull live data from Salesforce, HubSpot, or Pipedrive via Zapier. Auto-fill deal names, stages, and close probabilities to keep slides current without manual entry.
Q4 Forecast Deck
Use Case
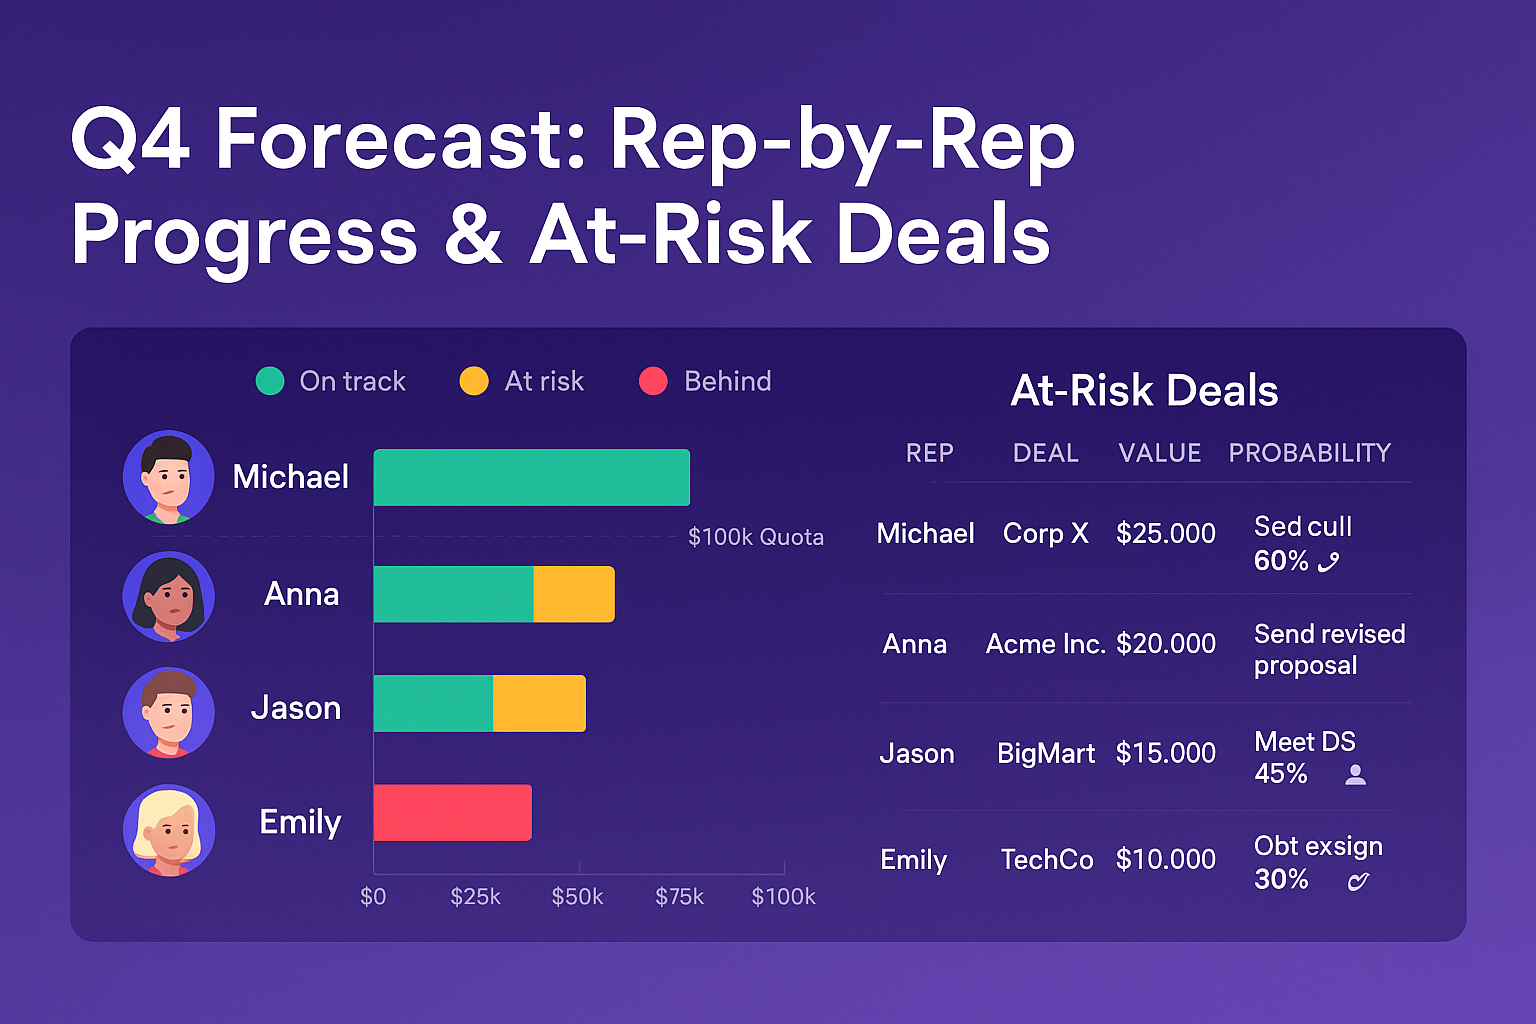
This is your visibility deck — the one leadership loves. It shows where you’re tracking for Q4, who’s pacing ahead or behind, and what risks need mitigation.
Slide Breakdown
- Closed-Won Recap (Q3 or early Q4)
- Forecast by Sales Rep
- Deal Risk Analysis
- Action Plan for At-Risk Opportunities
AI Slide Prompts
Create a Q4 Sales Forecast deck to provide leadership with visibility into performance pacing, rep accountability, and revenue risk. This deck is used in exec updates or revenue team meetings.
Include the following slides:
- Closed-Won Recap (Q3 or Early Q4):
Summarize closed deals from the previous quarter or current Q4 to date. Include total revenue, deal count, average deal size, and top-performing reps. Use bar or pie charts to visualize wins by segment or product. - Forecast by Sales Rep:
Present a breakdown of forecasted revenue by individual rep. Include quota, pipeline coverage, confidence level, and projected shortfall or overage. Use a table or side-by-side comparison chart. - Deal Risk Analysis:
List key deals at risk of slipping or losing. Include risk reasons (e.g., stalled comms, pricing objections), deal size, stage, and expected close date. Use visual indicators (e.g., red/yellow flags). - Action Plan for At-Risk Opportunities:
Outline tactical steps to recover or accelerate at-risk deals. Include responsible rep, next action date, and mitigation plan. Structure as a checklist or action grid.
Design Style:
Use a sharp, executive-ready layout with clear typography, bold section headers, and crisp data visuals. Stick to brand colors and avoid clutter.
Data Automation with Zapier:
Pull pipeline and forecast data from CRM (Salesforce, HubSpot, Pipedrive) via Zapier. Auto-fill slides with live values for quota attainment, deal status, and forecast adjustments.
Holiday Enablement Deck
Use Case
Arm your sales reps with ready-to-use slides for seasonal promotions, limited-time offers, and objection handling. Ideal for BDRs and AEs during outreach blitzes.
Slide Breakdown
- Holiday Offer Highlights
- Product Benefits (Seasonal Angle)
- Objection Handling Slide
- Customer Testimonials / Case Studies
AI Slide Prompts
Create a Holiday Sales Enablement deck designed for BDRs and AEs to use during outreach campaigns for seasonal promotions (e.g., Black Friday, end-of-year offers). The deck should be short, persuasive, and ready to drop into prospect calls or email follow-ups.
Include the following slides:
- Holiday Offer Highlights:
Present the core seasonal promotion. Include headline, discount or benefit (e.g., “20% Off Until Dec 1”), and any urgency drivers like “limited spots” or “early access bonuses.” Use bold visuals and minimal text. - Product Benefits (Seasonal Angle):
Highlight key product benefits framed around seasonal needs (e.g., “Save time before year-end reporting,” or “Launch your campaigns before CPCs surge”). Use icons or a feature grid. - Objection Handling Slide:
Preempt common pushbacks (e.g., “We’ll wait until January,” “No budget left”). For each objection, list a clear rebuttal. Use a two-column layout (objection → response). - Customer Testimonials / Case Studies:
Showcase short, relevant testimonials or a quick case study from a customer who used your product successfully during a past holiday period. Include name, logo, quote, and brief result.
Design Style:
High-impact, bold colors with holiday-themed accents. Use short headlines, simple icons, and clean layouts for fast readability during demos or cold calls.
Zapier Automation Tip:
Auto-fill testimonial slides using data from Typeform, Google Forms, or CRM feedback fields. Use shared folders (e.g., Google Drive, Notion) to dynamically update offer slides as promotions evolve.
When your sales team has these decks on hand, they’re no longer wasting time cobbling together slides on Sunday night. They’re focused on selling—and they’re armed with data and content that update themselves.
Decktopus AI handles the structure. Zapier automates the data. Your reps get to spend time where it matters: building pipeline and closing deals.
October Decks for Business Leaders
While sales and marketing gear up for execution, business leaders have a different kind of pressure in October: making decisions.
It’s time to reforecast budgets, prep board updates, and kickstart annual strategy planning — all while keeping teams aligned and accountable. These decks help leaders move fast, lead confidently, and present with clarity.
Board Update Deck
Use Case
Summarize Q3 performance, flag risks, and outline Q4 priorities in a board- or C-suite-friendly format. Clean, data-driven, and concise.
Slide Breakdown
- Q3 Financial KPIs (Revenue, Churn, Growth)
- Departmental Wins
- Key Risks + Dependencies
- Strategic Priorities for Q4
AI Slide Prompts
Create a Board Update deck to present Q3 performance, key risks, and Q4 priorities to executive leadership and board members. The tone should be data-driven, high-level, and action-oriented.
Include the following slides:
- Q3 Financial KPIs:
Display key performance metrics including total revenue, churn rate, customer growth, and gross margin. Use clean, minimal charts or tables. Include YoY or QoQ comparisons where helpful. - Departmental Wins:
Summarize 3–5 major wins across departments (e.g., marketing, product, sales). Keep each win to a short bullet point with measurable impact (e.g., “+27% MQLs from Q3 paid strategy”). - Key Risks & Dependencies:
List top operational or market risks affecting Q4 outcomes (e.g., hiring bottlenecks, budget constraints, vendor delays). Include status and mitigation plans. Use iconography or risk rating indicators. - Strategic Priorities for Q4:
Highlight 3 strategic focus areas for the upcoming quarter. These should reflect board-level concerns such as revenue acceleration, retention, or GTM expansion. Include owners or timelines where relevant.
Design Style:
Clean, minimal design with no fluff. Use brand colors, consistent fonts, and white space for clarity. Prioritize visual clarity over decoration.
Zapier Automation Option:
Pull financial data from Google Sheets, Excel, or BI tools into slides automatically. Auto-fill win summaries or risk trackers from internal dashboards (e.g., Asana, Notion).
Budget Reforecast Presentation
Use Case
October is the last clean month to reallocate budget based on what’s working. Use this deck to make the case for redistributing funds ahead of year-end.
Slide Breakdown
- Budget vs. Actual Spend (YTD)
- Remaining Budget by Department
- Reallocation Recommendations
- Supporting Data (Campaign ROI, Tool Usage, etc.)
AI Slide Prompts
Create a Budget Reforecast deck to help department leaders reallocate remaining Q4 budget based on current performance and business priorities. This presentation should enable fast decision-making before end-of-year spend freezes.
Include the following slides:
- Budget vs. Actual Spend (YTD):
Visualize the total budget vs. actual spend year-to-date. Use a bar chart or side-by-side comparison. Include percentage of budget used, overages, or underspend across categories. - Remaining Budget by Department:
Break down remaining funds across marketing, sales, ops, product, etc. Use a pie chart or table to show how much is left by team or initiative. - Reallocation Recommendations:
Propose reallocating funds from underperforming areas to higher-impact ones (e.g., shifting $20K from events to digital ads). Include rationale and expected outcomes. Use icons or directional visuals. - Supporting Data (ROI, Usage, etc.):
Provide proof for reallocation with ROI data from campaigns, tool usage stats, or performance benchmarks. Keep it simple — no more than 2–3 data visuals.
Design Style:
Clean and executive-friendly with clear headings, minimalist visuals, and focused callouts. Use department icons or color codes for easy reference.
Automation with Zapier:
Pull live budget data from Google Sheets, Excel, or finance software into slides. Connect performance dashboards (e.g., Looker, GA4) to update ROI metrics automatically.
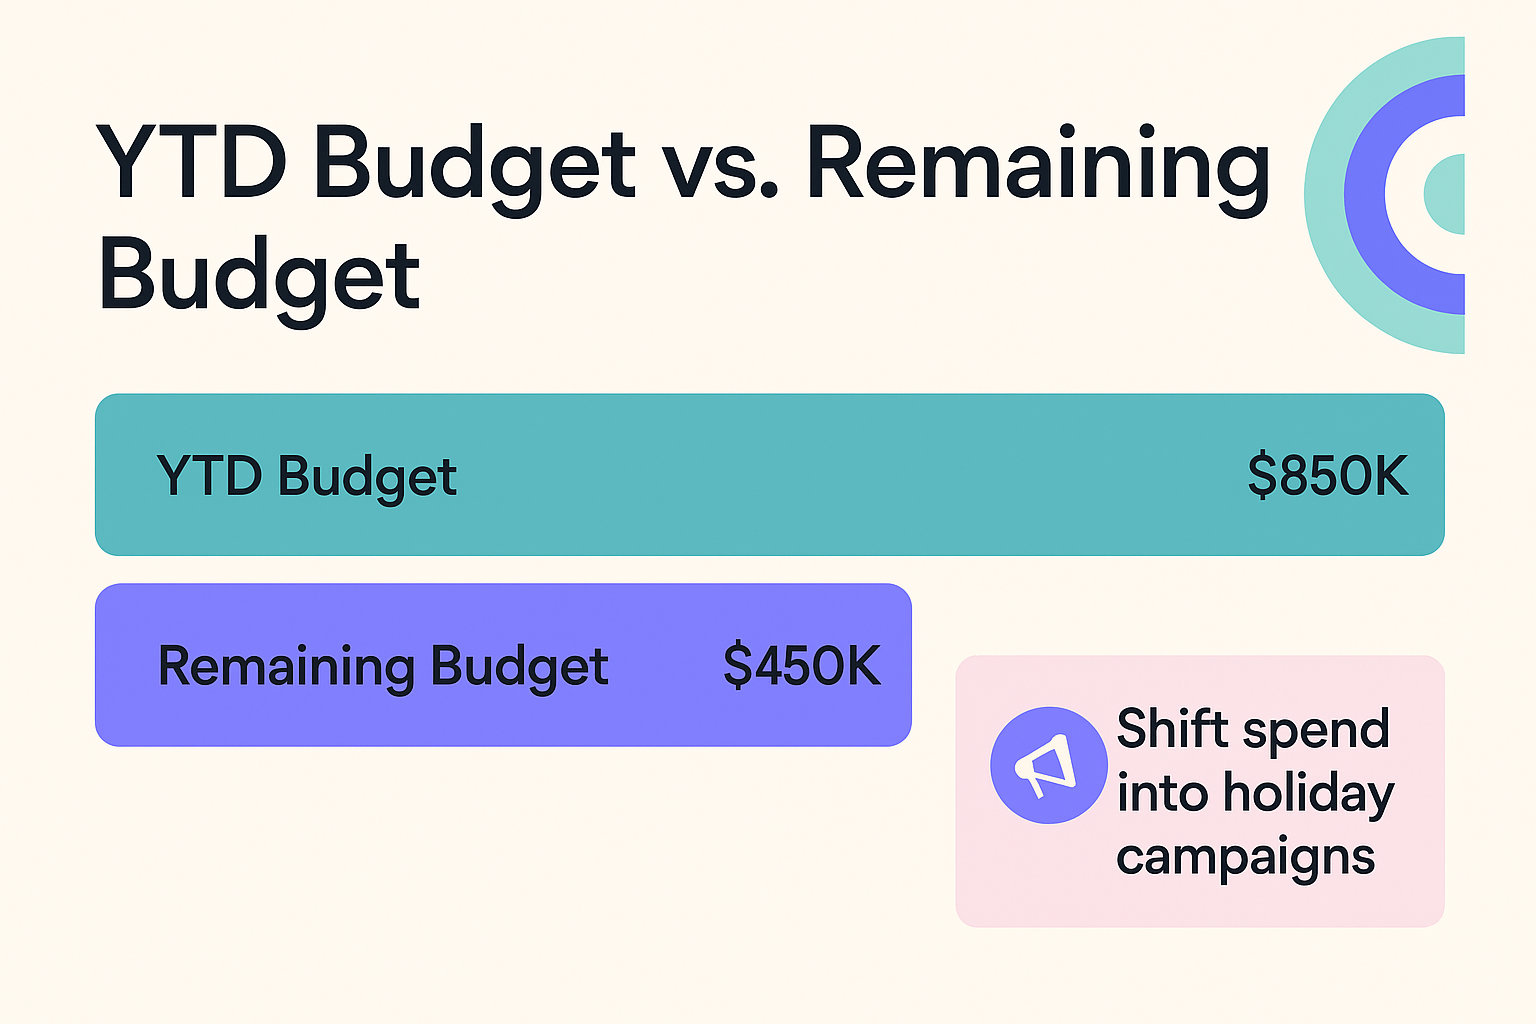
<insert image 8>
Alt: Slide showing YTD budget vs. remaining budget, with recommendations to shift spend into holiday campaigns
Strategy Kick-off Presentation (2026 Planning)
Use Case
Start laying the groundwork for long-term planning. Whether it’s a leadership offsite or first-pass strategy doc, this deck gives direction and sparks alignment.
Slide Breakdown
- Vision for 2026
- 3–5 Strategic Goals
- Department-Level Resource Needs
- Timeline for Planning Process
AI Slide Prompts
Create a Strategy Kick-off deck to initiate 2026 planning. This presentation will be used with senior leadership to align on long-term direction, strategic priorities, and resourcing needs. It should feel visionary yet actionable.
Include the following slides:
- Vision for 2026:
Articulate a bold but realistic vision for where the company aims to be by the end of 2026. Include 1–2 aspirational headlines and supporting bullet points (e.g., revenue targets, market position, customer impact). - 3–5 Strategic Goals:
List core strategic pillars for 2026 (e.g., “International Expansion,” “Platform Ecosystem Growth,” “Operational Efficiency”). Each goal should include a short description, success metric, and owner department. - Department-Level Resource Needs:
Highlight headcount, tooling, or budget required by each department to support the 2026 plan. Present in a table or grid with department names, requested resources, and justifications. - Timeline for Planning Process:
Lay out a visual roadmap from now through Q1 2026 for planning activities. Include dates for offsites, OKR setting, budget approval, and execution milestones.
Design Style:
Use clean, bold visuals with strategic colors (e.g., blue for vision, green for growth). Add directional icons or timeline markers. Keep layouts open and high-level.
Zapier Automation Tip:
Pull headcount forecasts or OKR data from tools like Notion, Asana, or Google Sheets to auto-populate planning timelines and resourcing slides.
These decks aren’t just about reporting—they’re tools for decision-making and influence.
With Decktopus AI, business leaders don’t have to rely on scattered spreadsheets and last-minute slide hacking. And with Zapier, real-time data fuels smarter planning—across departments, in one platform.
October is often underestimated. It feels early to plan for year-end—but wait too long, and you’re buried in back-to-back meetings, last-minute requests, and tight deadlines.
The smartest teams use October to get ahead. That means creating the decks that drive clarity, action, and alignment across the org:
- Marketers recap Q3, align Q4 campaigns, and pitch seasonal wins.
- Sales teams clean pipelines, forecast accurately, and prep enablement decks.
- Business leaders present to boards, reforecast budgets, and launch strategic planning.
But here’s the secret: You don’t need to spend hours building these decks.
With Decktopus AI, you can generate stunning, structured presentations in minutes—complete with tailored prompts for every team. And when you connect it to your tools with Zapier, your decks stay synced with the latest data, automatically.
No more exporting. No more formatting. No more last-minute chaos.
Whether you're presenting ad results, prepping forecasts, or pitching 2026 strategy — Decktopus makes it fast, flexible, and future-proof.
🎯 Ready to Work Smarter?
Start your free account today and build your October decks in minutes — with the help of AI, automation, and zero blank slides.
👉 Get Started with Decktopus AI
(Integrations with Zapier, Google Ads, GA4, Salesforce, and more included.)


.svg)
.svg)
.svg)
.svg)
.svg)
.svg)
.svg)
